Cardano (ADA) is gaining pace above the $0.350 resistance. ADA is showing heavy bullish signs and might rally toward $0.400 or even $0.420.
ADA price outperformed Bitcoin and rallied above the $0.350 resistance.
The price is trading above $0.350 and the 100 simple moving average (4 hours).
There is a key bullish trend line forming with support near $0.3505 on the 4-hour chart of the ADA/USD pair (data source from Kraken).
The pair could accelerate higher toward the $0.400 level or even $0.420.
In the past few days, Cardano saw a decent increase from the $0.2850 support. It is up over 20% and broke many hurdles near the $0.350 resistance zone, outperforming Bitcoin and Ethereum.
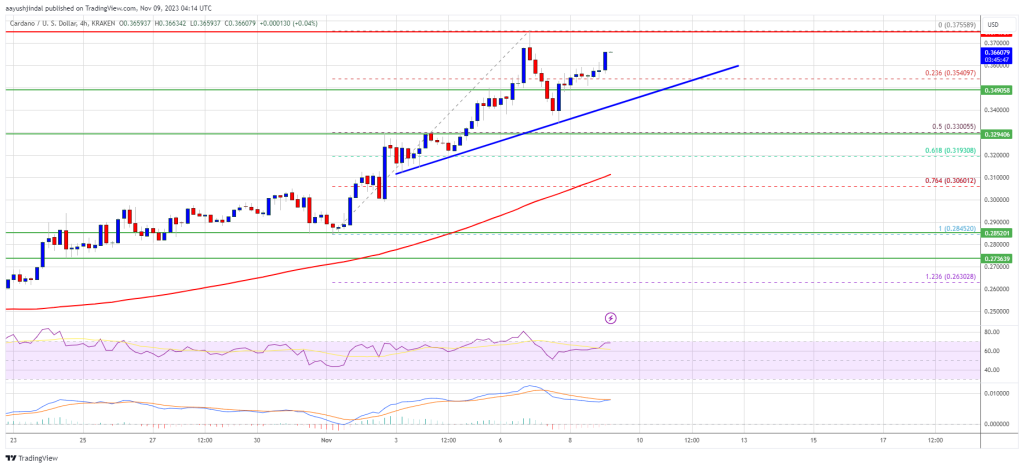
The upward move was such that the price spiked toward $0.3750. A high was formed near $0.3755 before there was a downside correction. The price declined below the $0.3550 support. It spiked below the 23.6% Fib retracement level of the upward move from the $0.2845 swing low to the $0.3755 high.
However, the bulls were active above the $0.3400 zone. There is also a key bullish trend line forming with support near $0.3505 on the 4-hour chart of the ADA/USD pair.
Source: ADAUSD on TradingView.com
ADA is now trading above $0.350 and the 100 simple moving average (4 hours). On the upside, immediate resistance is near the $0.3750 zone. The first resistance is near $0.380. The next key resistance might be $0.400. If there is a close above the $0.400 resistance, the price could extend its rally. In the stated case, the price could rise toward the $0.420 region.
If Cardano’s price fails to climb above the $0.3750 resistance level, it could start a downside correction. Immediate support on the downside is near the $0.3550 level.
The next major support is near the $0.350 level and the trend line. A downside break below the $0.350 level could open the doors for a test of the 50% Fib retracement level of the upward move from the $0.2845 swing low to the $0.3755 high at $0.3300. The next major support is near the $0.3080 level.
Technical Indicators
4 hours MACD – The MACD for ADA/USD is gaining momentum in the bullish zone.
4 hours RSI (Relative Strength Index) – The RSI for ADA/USD is now above the 50 level.
Major Support Levels – $0.355, $0.350, and $0.330.
Major Resistance Levels – $0.375, $0.400, and $0.420.
—
Blog powered by G6
Disclaimer! A guest author has made this post. G6 has not checked the post. its content and attachments and under no circumstances will G6 be held responsible or liable in any way for any claims, damages, losses, expenses, costs or liabilities whatsoever (including, without limitation, any direct or indirect damages for loss of profits, business interruption or loss of information) resulting or arising directly or indirectly from your use of or inability to use this website or any websites linked to it, or from your reliance on the information and material on this website, even if the G6 has been advised of the possibility of such damages in advance.
For any inquiries, please contact [email protected]


