Wall Street’s biggest gold fund saw something unusual recently — a single-day outflow of $3 billion from SPDR Gold Shares, a number that dwarfed any comparable daily exit over the prior two years by more than 200%.
The $3 billion single-day outflow from SPDR Gold Shares — a US gold-backed ETF trading under the ticker GLD — was flagged by the Kobeissi Letter as exceeding any comparable daily exit over the prior two years by more than 200%.
On the same side of the ledger, Bitcoin exchange-traded funds recorded over $900 million in net inflows over the 30 days ending March 11, swinging from close to $2 billion outflow the month before.
BREAKING: The largest US gold-backed ETF, $GLD, posted a record -$3.0 billion outflow on Wednesday.
This surpasses any previous large daily outflow seen over the last 2 years by +200%.
At the same time, silver ETFs recorded small outflows, while Bitcoin ETFs saw modest inflows.… pic.twitter.com/XF8y99cPSV
— The Kobeissi Letter (@KobeissiLetter) March 6, 2026
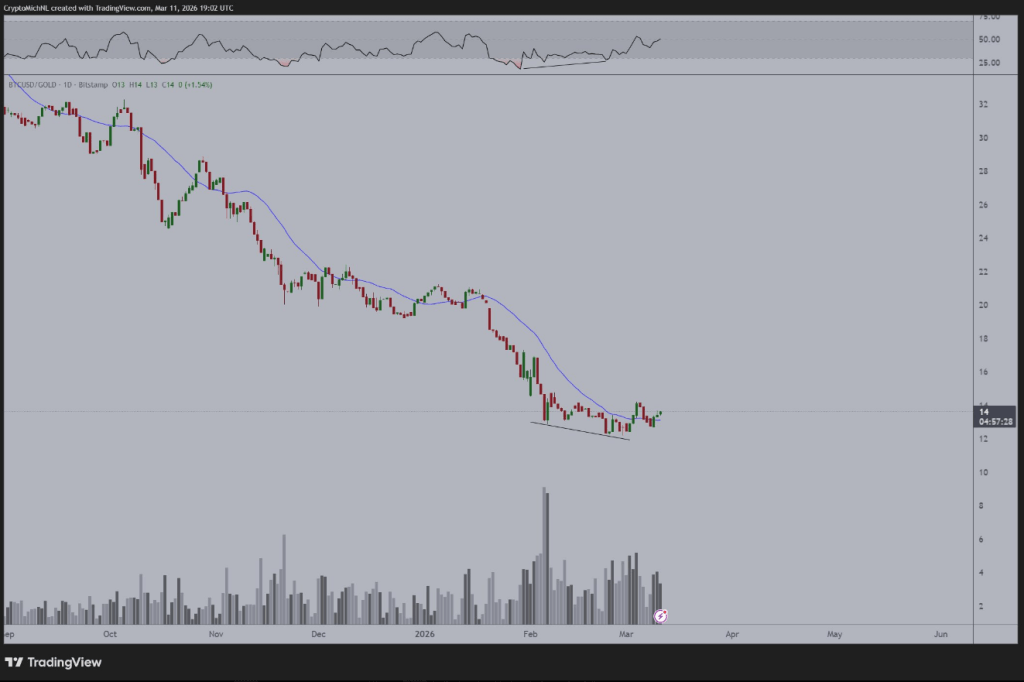
The Bitcoin-to-gold ratio has pulled back to a support zone near 12-13 — a level that blocked further gains in 2017, then flipped to support in 2022 and 2023.
Analysts say that history gives the current price level added weight. Michaël van de Poppe, founder of MN Capital, points to a bullish divergence forming between the ratio and the relative strength index on the daily chart.
In plain terms, that means selling pressure appears to be fading even as prices have stayed under stress. Whether that signal holds is another matter, but it has drawn attention from traders tracking Bitcoin’s long-term standing against gold.
#Bitcoin vs. Gold is currently breaking upwards after a confirmation of the bullish divergence.
This should indicate that we’re about to see significantly more strength in Bitcoin. pic.twitter.com/vwIpwJ82qz
— Michaël van de Poppe (@CryptoMichNL) March 11, 2026
The shift in ETF holdings reinforces the picture. Bitcoin ETF balances improved by roughly 12,900 BTC in the last monthly timeframe, while gold ETF holdings fell by nearly 800,000 ounces during a similar window. Capital appears to be moving, even if slowly.
Binance Research flagged the current stretch of market volatility as what it called an “opportunity within risk” for Bitcoin.
Bitcoin has traded in step with oil and US equities recently, moving alongside broader macro assets as the US-Israel and Iran conflict has kept global markets on edge. Despite that turbulence, institutional interest has not dried up.
US spot ETFs now account for roughly 9% of total Bitcoin trading volume. That sounds modest — and it is. In US equity markets, ETFs account for 30-40% of total trading volume. The gap tells its own story about how much room remains for institutional participation to grow.
History Offers A Cautionary But Compelling Pattern
Midterm election years have not been kind to risk assets. The S&P 500 has averaged a peak-to-trough drop of 16% during those cycles.
Bitcoin’s drawdowns have been steeper, averaging around 56%. But the 12 months after midterm elections have, without exception since 1939, produced positive returns for the S&P 500, averaging 19% gains.
Bitcoin, with only three post-midterm years on record, has averaged 54% gains across all three.
Reports from Binance Research also identified $78,000 as the level Bitcoin would need to reclaim to signal a broader trend reversal.
BTC was trading around $71,500 at the time of publication. The distance between the two numbers is not enormous, but in a market moving this quickly, it is not small either.
Featured image from Incrementum, chart from TradingView
—
Blog powered by G6
Disclaimer! A guest author has made this post. G6 has not checked the post. its content and attachments and under no circumstances will G6 be held responsible or liable in any way for any claims, damages, losses, expenses, costs or liabilities whatsoever (including, without limitation, any direct or indirect damages for loss of profits, business interruption or loss of information) resulting or arising directly or indirectly from your use of or inability to use this website or any websites linked to it, or from your reliance on the information and material on this website, even if the G6 has been advised of the possibility of such damages in advance.
For any inquiries, please contact [email protected]


