The market has struggled to push above the significant resistance level of $25K, and now the price is slowly declining. Therefore, the possibility of a correction before the next rally has increased.
By Shayan
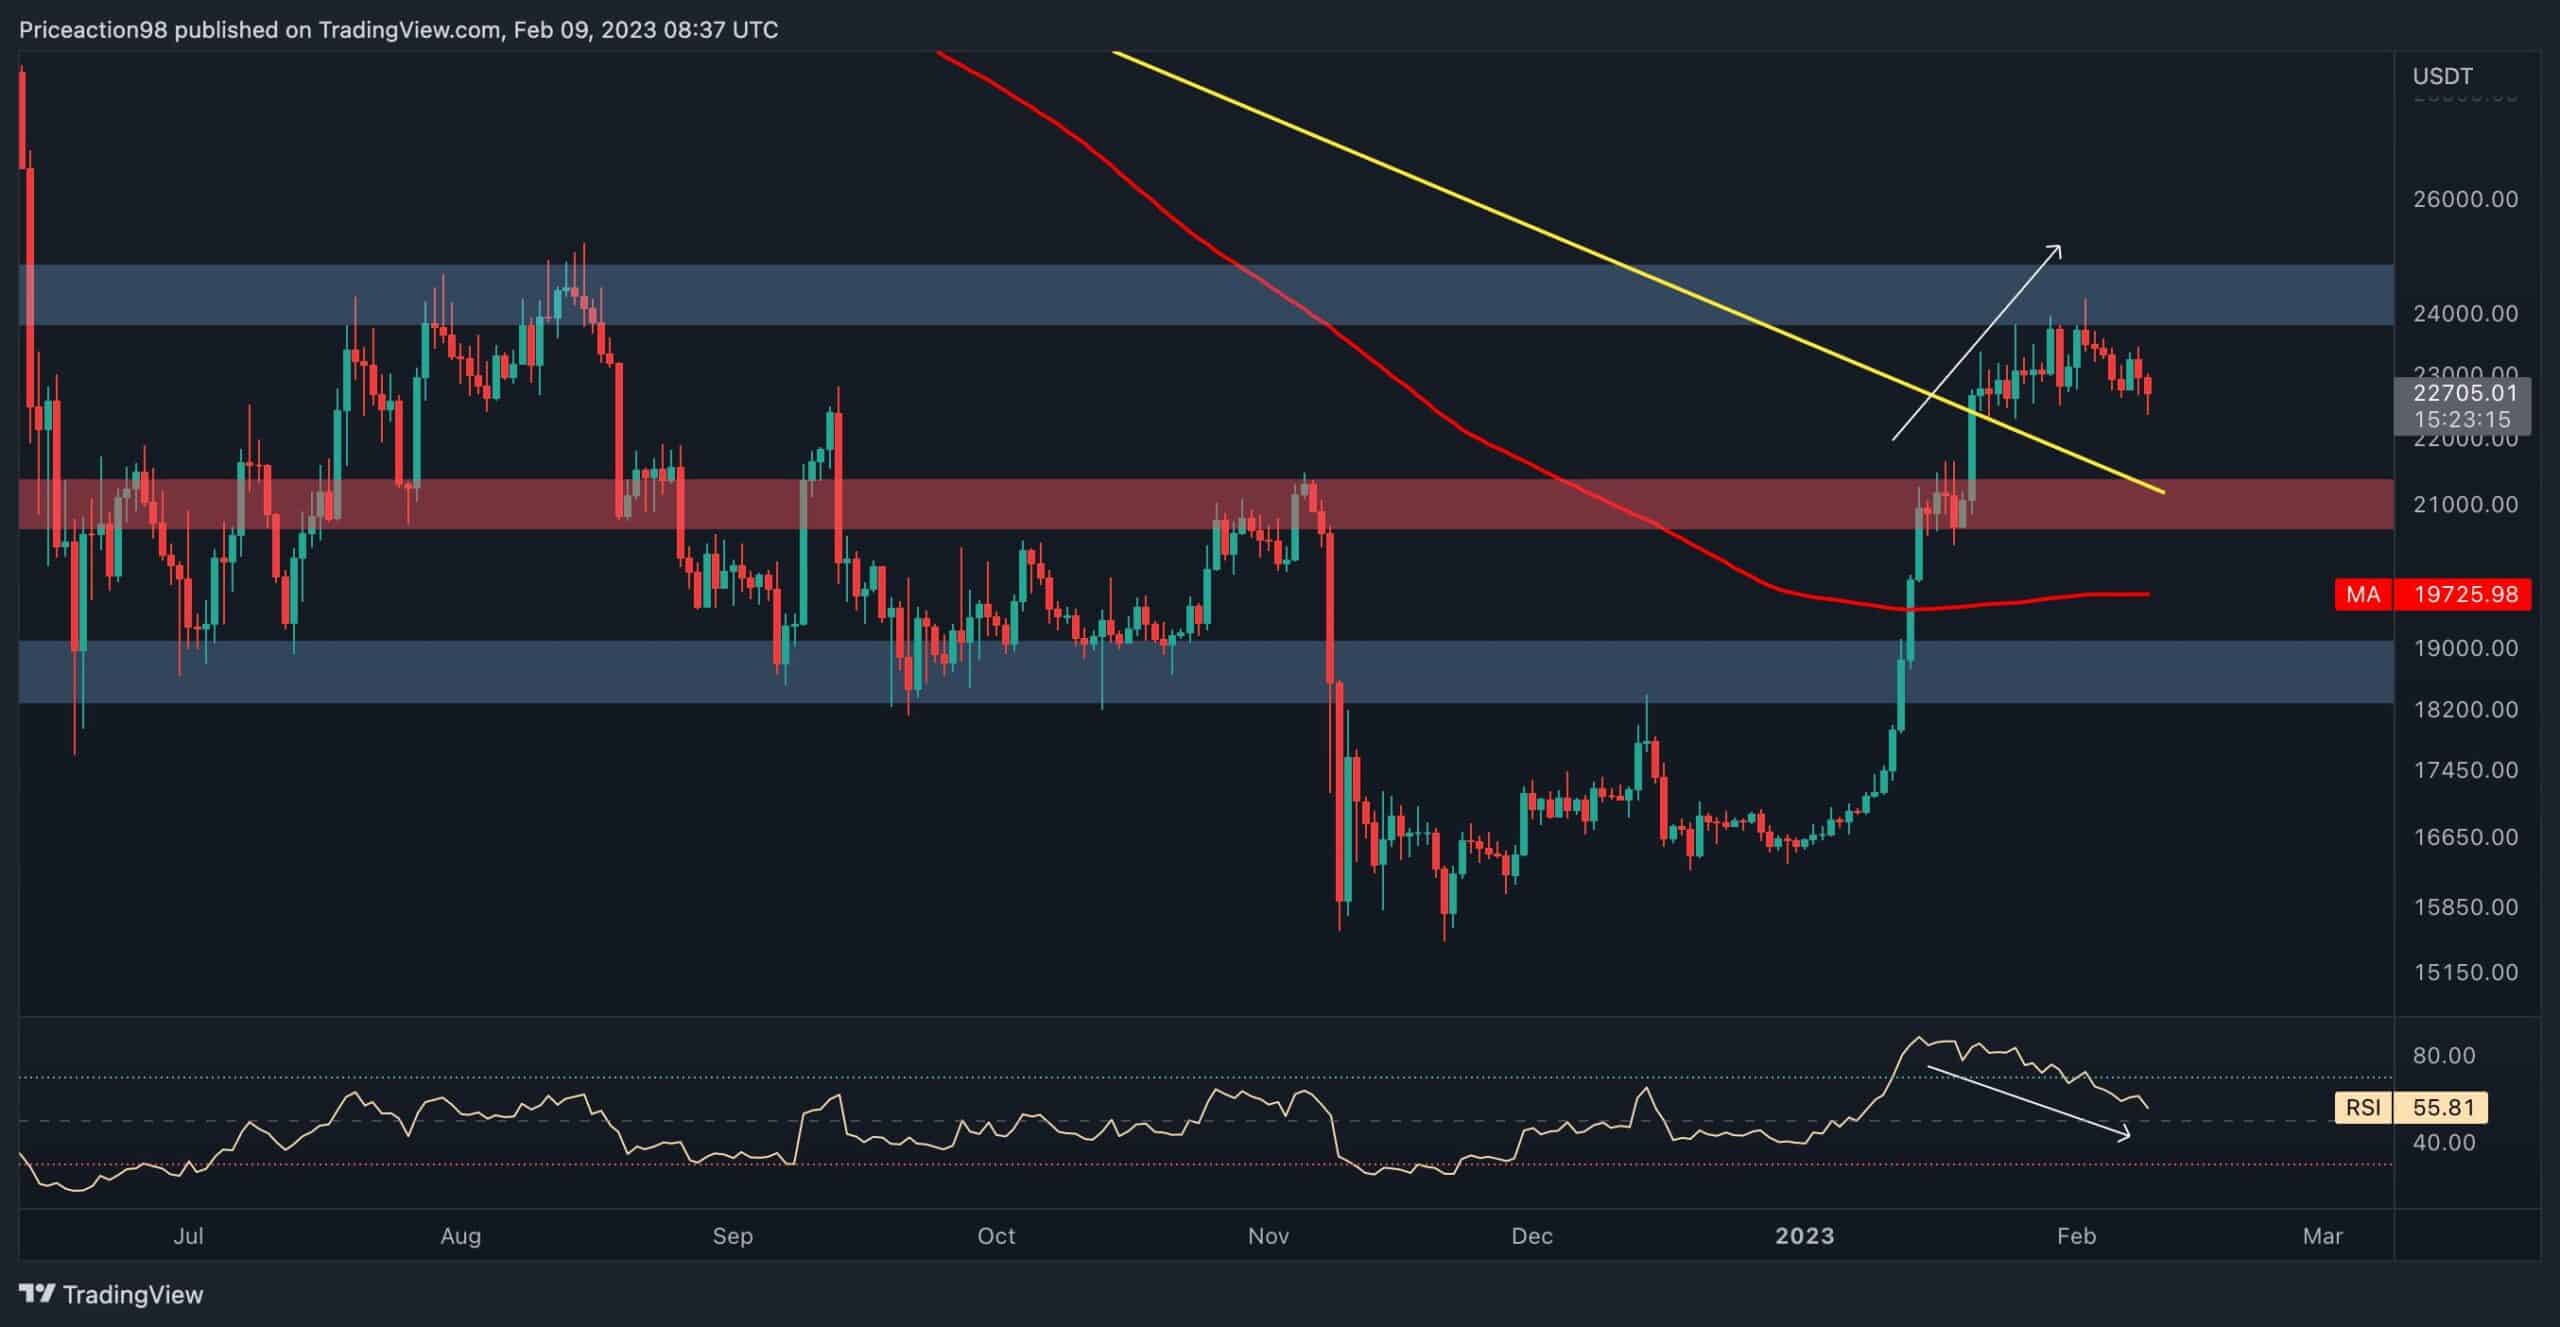
The $24K-$25K region is currently providing the most significant resistance for Bitcoin on the daily timeframe. It’s also a vital psychological level, as it has been the main barrier during the last eight months.
However, due to the recent bullish stage of the market, the price has surged and reached the $24K region. Yet, the bulls failed to push the price above it, and it was rejected. Also, a prolonged bearish divergence between the price and the RSI indicator increases the likelihood of a short-term correction.
Nevertheless, the cryptocurrency might retest the 200-day moving average and the broken trendline before initiating another rally, aiming for $25K.
On the 4-hour timeframe, the price plummeted below the flag’s lower boundary and retested the trendline to complete the pullback, signaling a validation of the described pattern. However, the positive momentum was weaker than expected, causing BTC to fluctuate.
Meanwhile, a static support level has formed at the $22.3K level. As a result, many sell-stop orders below this support level provide adequate liquidity for the market to grab before initiating the next move.
Hence, this approves the short-term consolidation correction scenario for now, unless the bulls surprise the market and print a big green candle on the BTC charts.
By Shayan
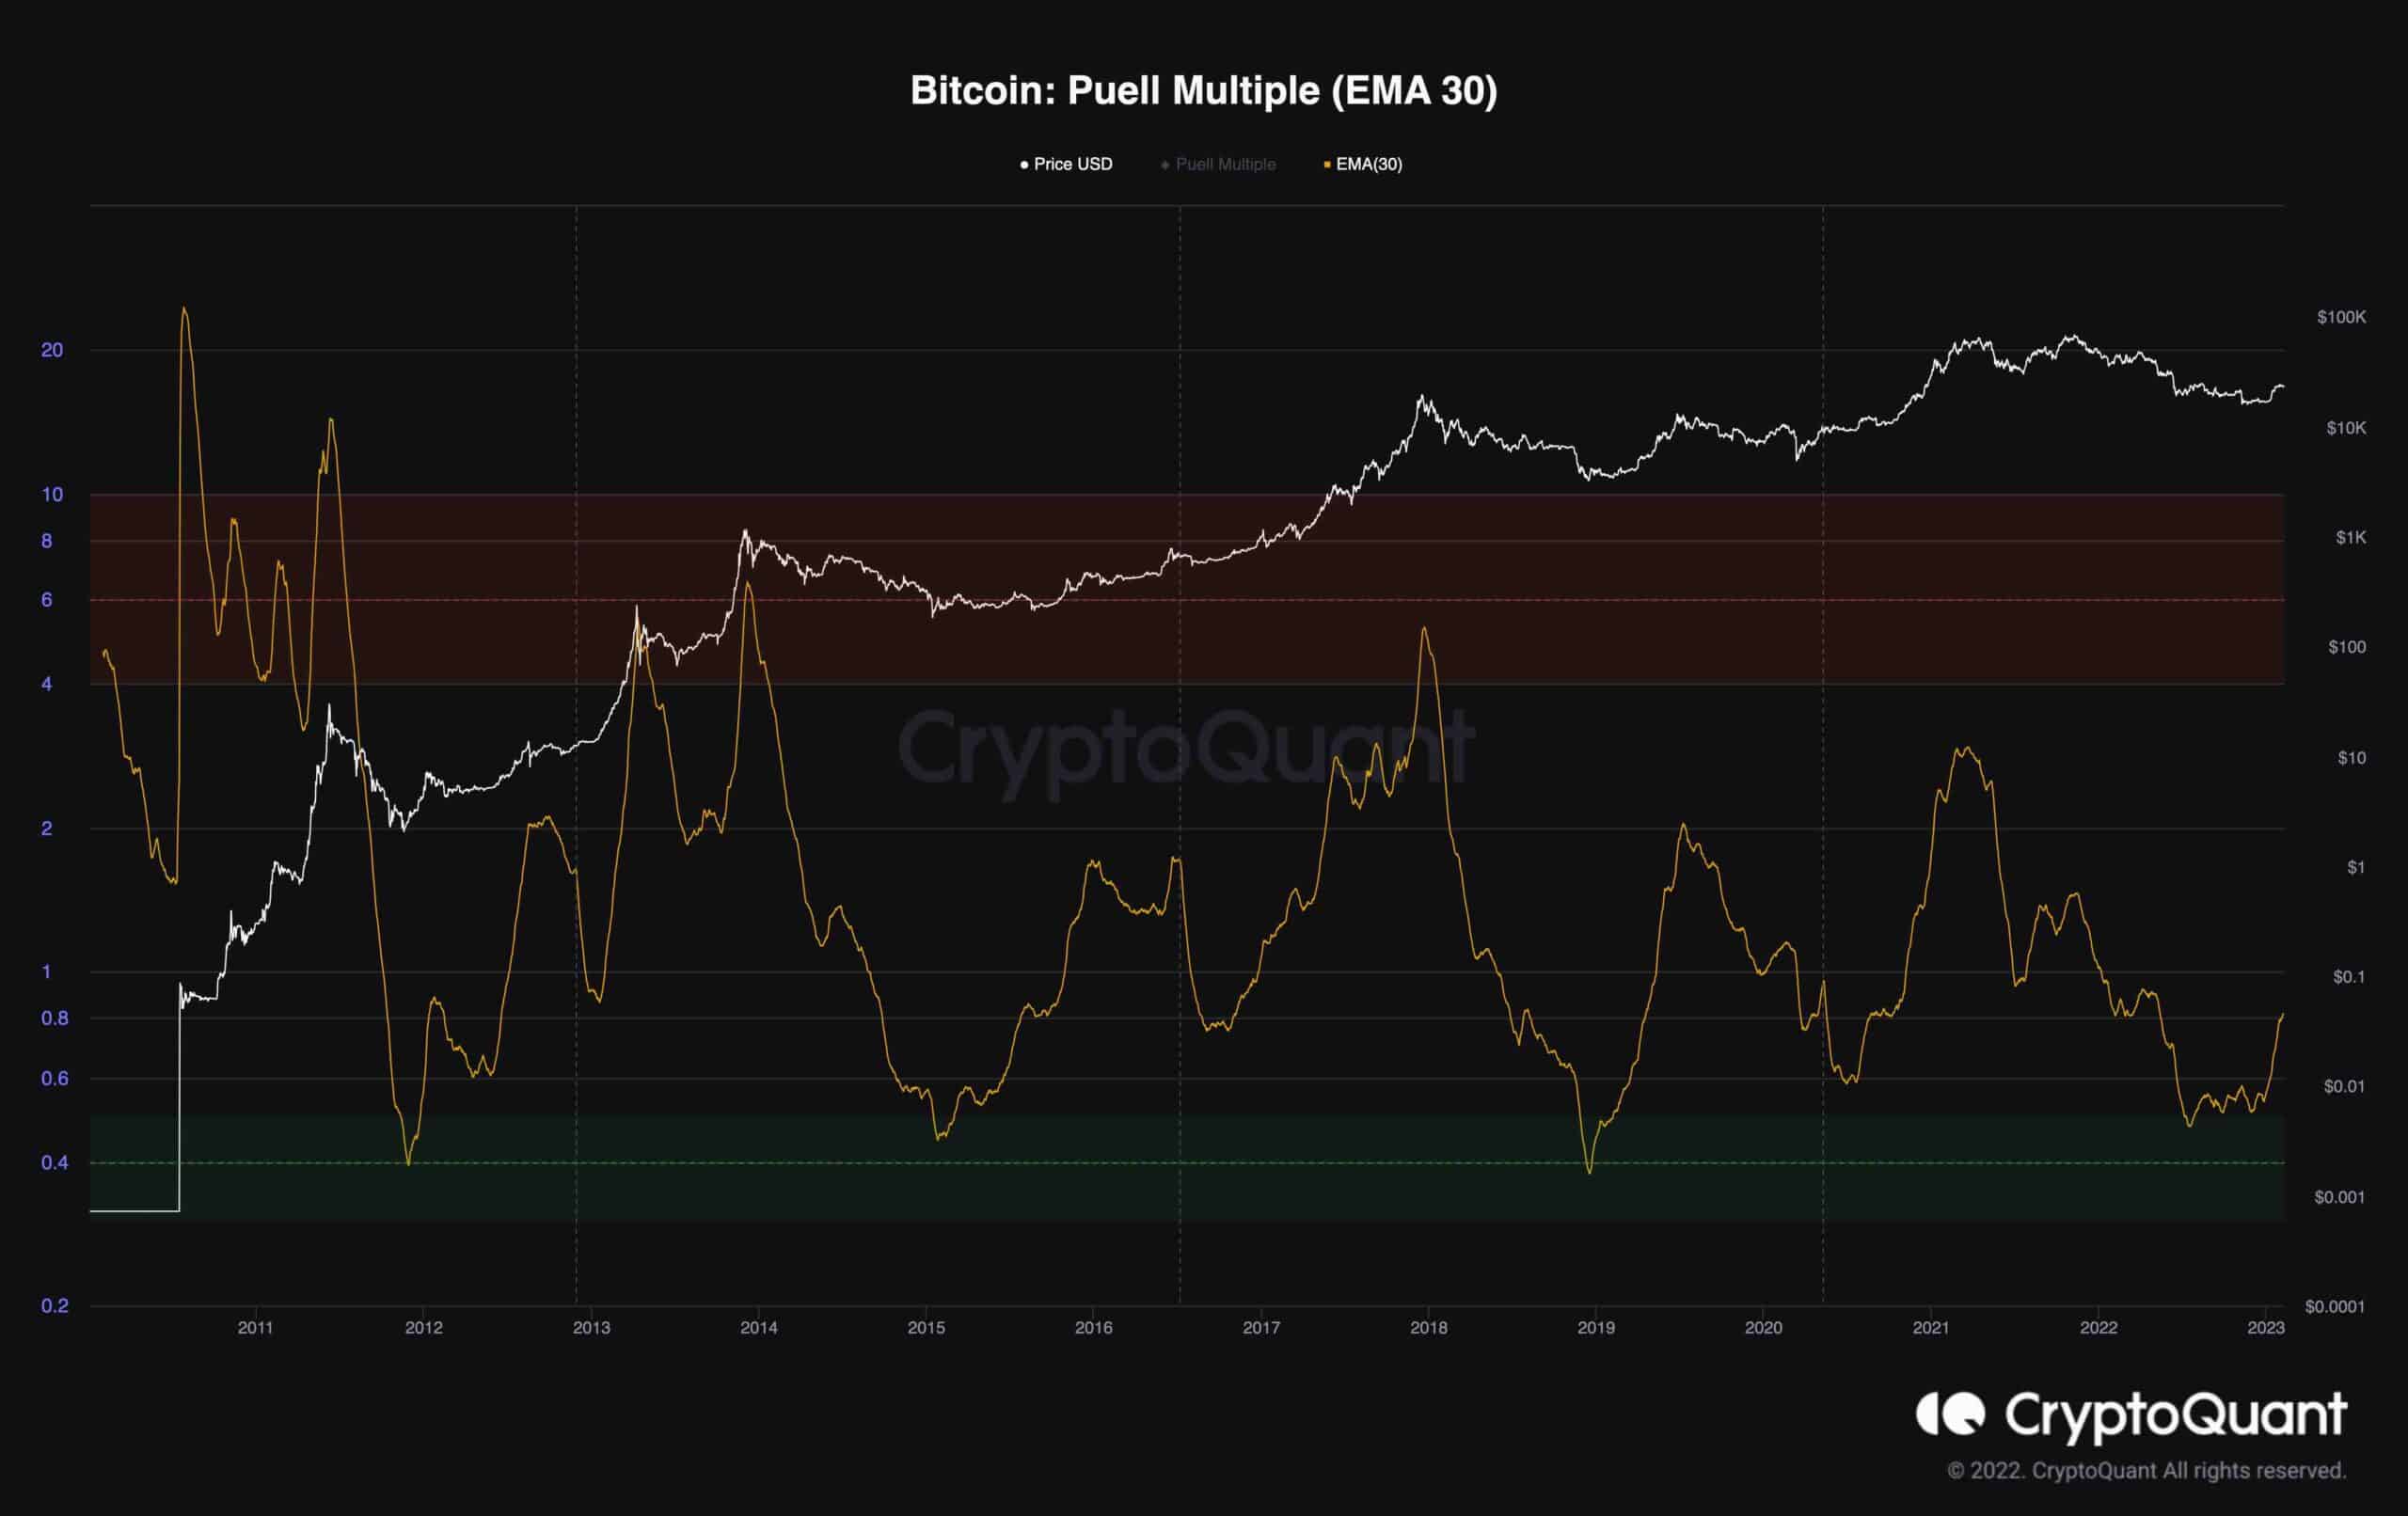
The Puell Multiple metrics provide participants with a broader insight into the market stage by asking, “How profitable are mining pools in comparison to the past year if all the Bitcoins created were distributed instantly on the market?”
Historically, each time the metric declined to the green zone, the market finally found a bottom and marked the final phase of the bear stage. Accordingly, the metric had dropped to the green zone due to Bitcoin’s massive downtrend over the last months. However, the recent uptrend in Bitcoin’s price has led to a surge and the green zone’s exit.
This could be interpreted as a bullish sign, indicating the bear market is over, and Bitcoin might have found its bottom. Nevertheless, a reverse scenario is always on the table, and the recent price surge might be another significant bull trap. Hence, it is better to watch out.
The post Bitcoin Loses $23K, but is Another Surge Coming? (BTC Price Analysis) appeared first on CryptoPotato.
—
Blog powered by G6
Disclaimer! A guest author has made this post. G6 has not checked the post. its content and attachments and under no circumstances will G6 be held responsible or liable in any way for any claims, damages, losses, expenses, costs or liabilities whatsoever (including, without limitation, any direct or indirect damages for loss of profits, business interruption or loss of information) resulting or arising directly or indirectly from your use of or inability to use this website or any websites linked to it, or from your reliance on the information and material on this website, even if the G6 has been advised of the possibility of such damages in advance.
For any inquiries, please contact [email protected]


