Bitcoin’s powerful breakout has lost some of its initial momentum after reaching the $80K region. With both spot price action and futures activity showing reduced conviction, BTC appears increasingly likely to enter a choppy consolidation phase before establishing its next major directional move.
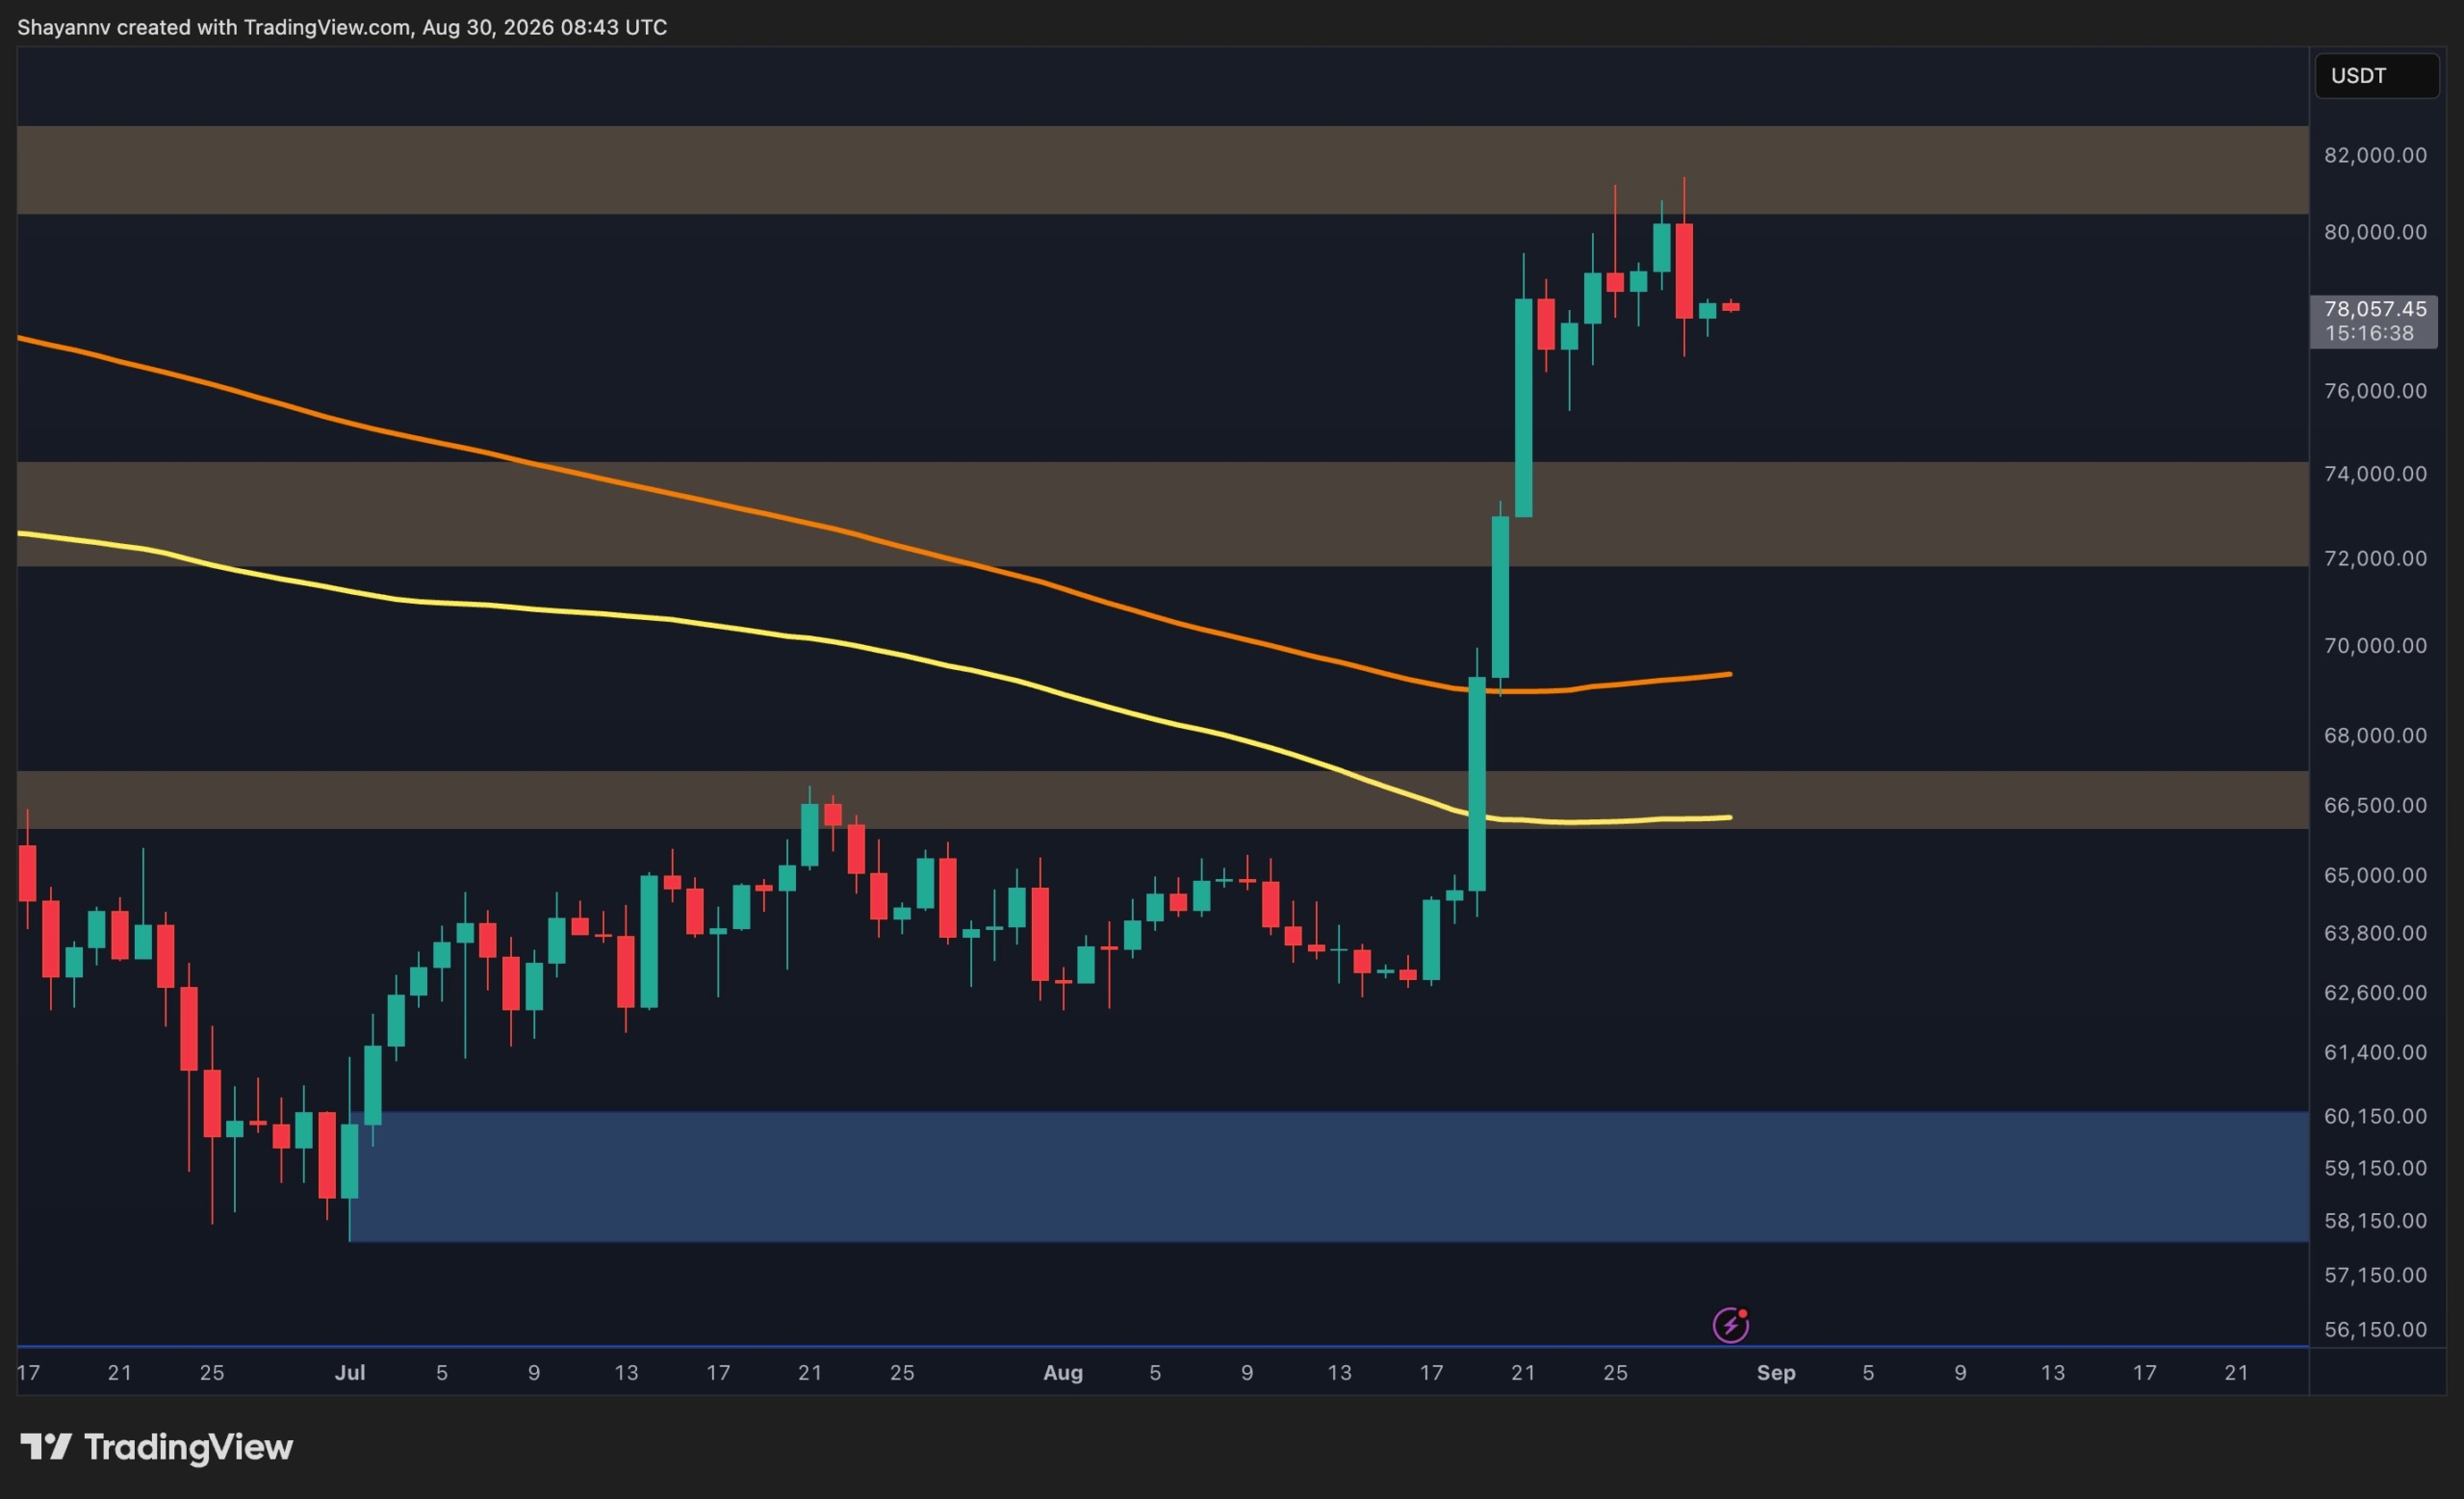
Bitcoin’s daily structure remains substantially stronger following the impulsive breakout from the $64K-$65K region. The rally pushed the price above both major moving averages shown on the chart and decisively cleared the $65.9K-$67.1K and $72K-$74.4K resistance zones.
However, bullish momentum has faded after BTC reached the major $80.5K-$82.5K supply zone. Several recent candles show hesitation beneath this area, with Bitcoin currently hovering above $78K. This suggests that buyers have not yet generated enough follow-through to force another decisive expansion.
The broader structure remains bullish while BTC stays above the reclaimed $72K-$74.4K zone, but the immediate outlook appears more neutral. Continued weakness in momentum could result in sideways and volatile price action between this support area and the $80.5K-$82.5K resistance zone.
A decisive break above $82.5K would favor bullish continuation. Conversely, losing the $72K-$74.4K region would represent a more meaningful deterioration in the post-breakout structure.
The 4-hour timeframe provides a clearer indication that short-term momentum is weakening. Following the initial surge, Bitcoin formed a rising channel beneath the $80K-$82K resistance area. The asset has now broken below the channel’s lower boundary, interrupting the sequence of higher lows.
Despite this breakdown, BTC has not accelerated significantly lower and is instead stabilizing around $77K-$78K. This lack of bearish follow-through reinforces the possibility of choppy consolidation rather than an immediate large correction.
For buyers to regain short-term control, Bitcoin would need to reclaim the broken channel and push back through the $80K region. Until that occurs, the recent highs around $80K-$82K remain the primary resistance zone.
On the downside, the $72K-$74.4K area represents the most important nearby support. With momentum fading on both sides, BTC could continue fluctuating between these broader boundaries while the market searches for sufficient liquidity to establish its next trend.

The Bitcoin Futures Average Order Size chart supports the lack-of-momentum scenario. The metric categorizes futures activity according to the relative size of orders, providing insight into whether whales, smaller participants, or more ordinary flows are dominating trading.
The latest readings are predominantly classified as normal orders, with no sustained cluster of large whale activity visible at the end of the chart. This indicates that major futures participants are not showing particularly strong directional conviction despite Bitcoin trading near $78K.
Combined with the hesitation visible in spot price action, the absence of notable large futures orders suggests participation is currently insufficient to support another highly impulsive move. Neither aggressive demand nor overwhelming supply appears dominant.
As a result, Bitcoin may remain vulnerable to low-momentum, volatile consolidation in the short term. A renewed concentration of large whale orders alongside a breakout from the current spot range would provide a stronger indication that directional momentum is returning.
The post Bitcoin Price Analysis: Is BTC Entering a Consolidation Phase After Its Explosive Rally? appeared first on CryptoPotato.
—
Blog powered by G6
Disclaimer! A guest author has made this post. G6 has not checked the post. its content and attachments and under no circumstances will G6 be held responsible or liable in any way for any claims, damages, losses, expenses, costs or liabilities whatsoever (including, without limitation, any direct or indirect damages for loss of profits, business interruption or loss of information) resulting or arising directly or indirectly from your use of or inability to use this website or any websites linked to it, or from your reliance on the information and material on this website, even if the G6 has been advised of the possibility of such damages in advance.
For any inquiries, please contact [email protected]