Bitcoin is showing signs of tentative recovery after holding $60k support. The price is now located around the low $70k region once again. The overall macro situation just shifted slightly with news of a temporary ceasefire emerging in the Iran conflict, which has previously influenced risk sentiment and commodity markets.
This geopolitical development could ease immediate macro risk premia. However, the ceasefire is widely described as fragile and conditional, with key disputes unresolved.
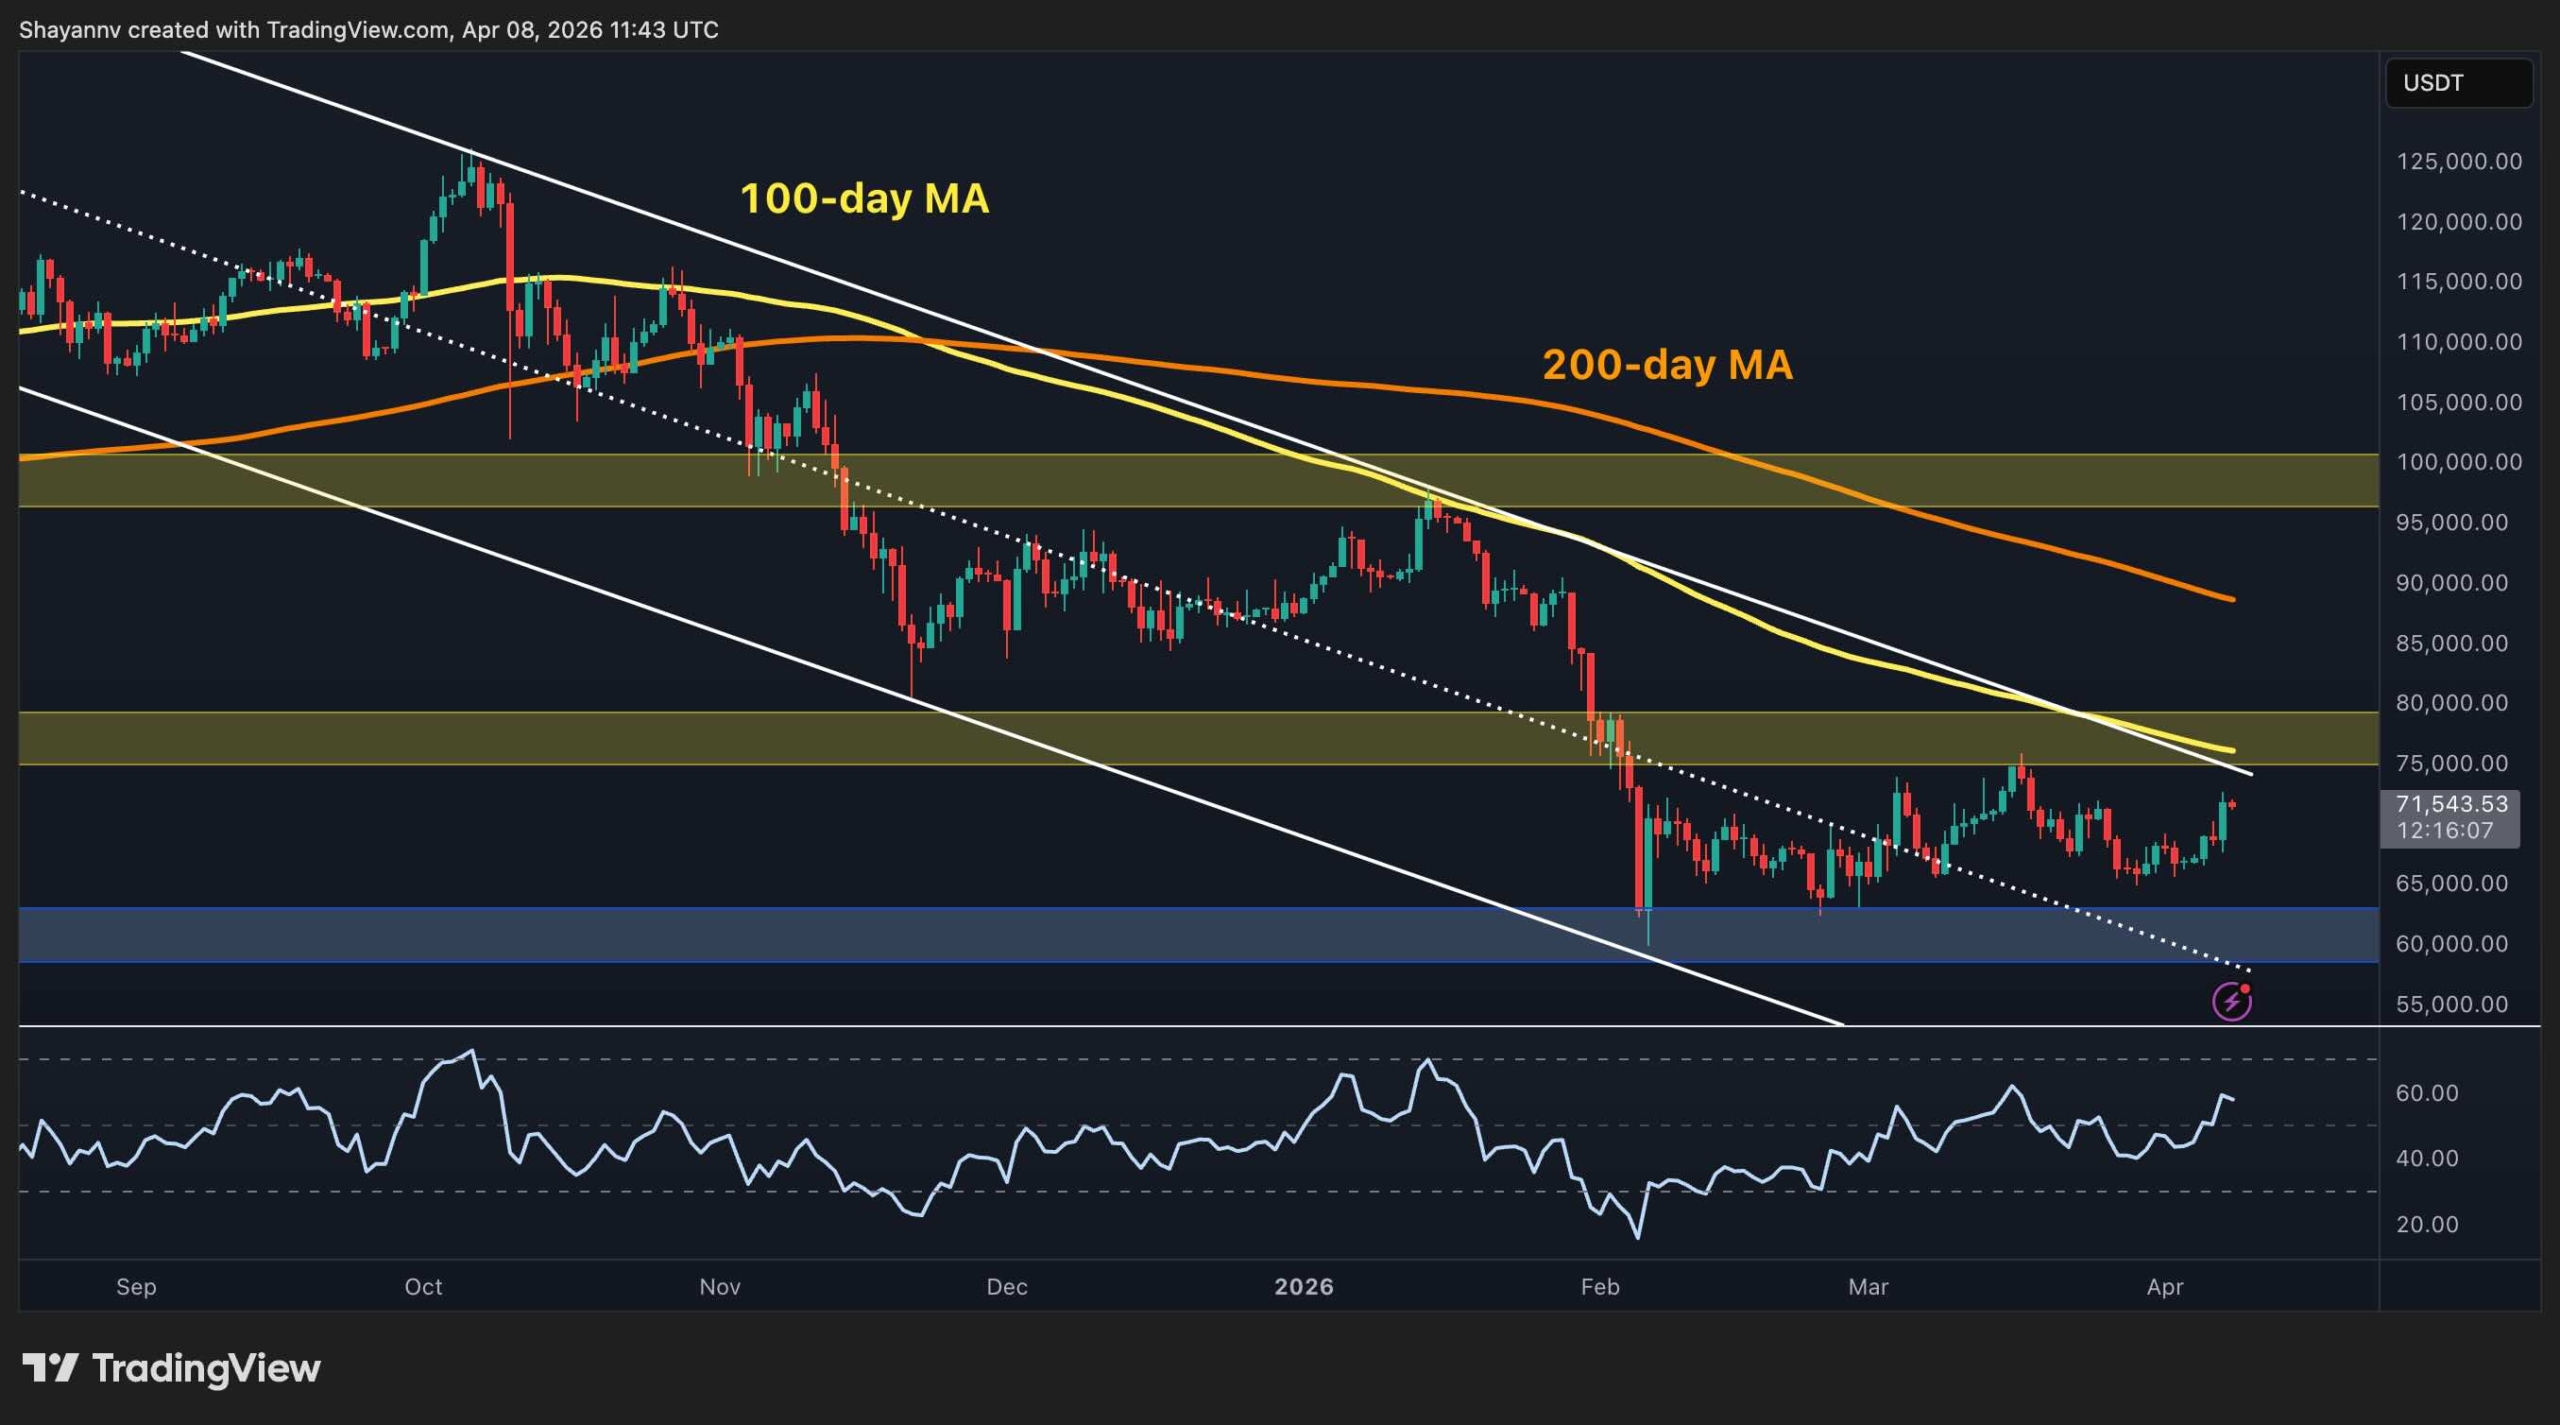
On the daily timeframe, BTC price remains in a long‑term downtrend. The direction is defined by the 100‑day (~$75k) and 200‑day (~$90k) moving averages, which continue to slope lower.
With the RSI also showing bullish momentum, the price is now on its way to retest the $75k-$80k supply zone. This zone is accompanied by the higher boundary of the long-term descending channel and the 100-day moving average. This confluence makes the $75k level a key area to watch.
A breakout above the aforementioned zone could pave the way for a rally toward the 200-day moving average, and potentially a retest of the $100k level. On the other hand, if the price gets rejected from the $75k zone, another drop toward the $60k support level could be expected in the coming weeks.
On the 4‑hour chart, Bitcoin remains range‑bound within an ascending channel, with a lower boundary near $66k and an upper boundary near $78k. The price has recently tested the lower boundary and rebounded. The internal trend shows short‑term higher highs over the recent sessions, indicating a move toward the $75k horizontal resistance level.
Momentum is also showing buyers’ dominance, but with the RSI hovering around the overbought region, the market might take more time than expected to clear the mentioned resistance. On the contrary, a rejection from this level without the price even reaching the higher boundary of the channel could be a warning signal that drags the price back to the $60k area and potentially lower.

From an on-chain perspective, the Net Unrealized Profit/Loss (NUPL) metric sits in a low profit‑share zone similar to levels seen during prior major accumulation phases, suggesting many holders are not realizing significant gains. This often points to a cautious market that has absorbed more of the previous downturn without renewed speculative excess.
That backdrop could provide a foundation for choppier consolidation rather than a sustained selloff. However, if the price begins to print higher highs and lows soon, this could indicate that the current stage is a heavy accumulation, and could set the market up for a sustainable recovery in the coming months.

The post Bitcoin Price Analysis: What Are BTC’s Next Targets After Surging Past $70K? appeared first on CryptoPotato.
—
Blog powered by G6
Disclaimer! A guest author has made this post. G6 has not checked the post. its content and attachments and under no circumstances will G6 be held responsible or liable in any way for any claims, damages, losses, expenses, costs or liabilities whatsoever (including, without limitation, any direct or indirect damages for loss of profits, business interruption or loss of information) resulting or arising directly or indirectly from your use of or inability to use this website or any websites linked to it, or from your reliance on the information and material on this website, even if the G6 has been advised of the possibility of such damages in advance.
For any inquiries, please contact [email protected]


