Bitcoin price struggled below the $68,500 resistance zone. BTC is correcting gains and might decline further below the $65,500 support zone.
Bitcoin started a correction wave from the $68,500 resistance zone.
The price is trading below $66,500 and the 100 hourly Simple moving average.
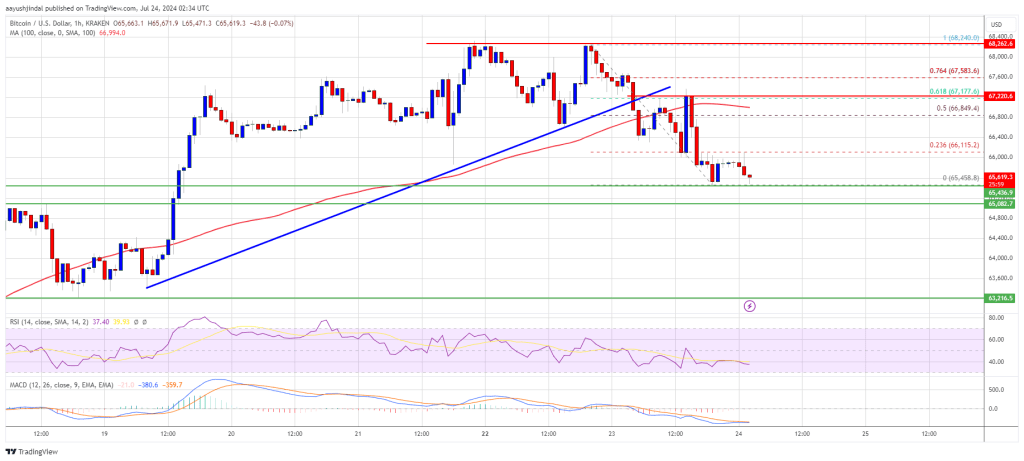
There was a break below a key bullish trend line with support at $67,200 on the hourly chart of the BTC/USD pair (data feed from Kraken).
The pair might extend losses and trade below the $65,500 support zone.
Bitcoin price failed to stay above the $66,500 and $67,000 resistance levels. BTC extended its decline and traded below the $66,000 support level to move into a short-term bearish zone.
There was a break below a key bullish trend line with support at $67,200 on the hourly chart of the BTC/USD pair. The pair even spiked below the $65,500 level. A low is formed at $65,458 and the price is now consolidating losses. It is trading below the 23.6% Fib retracement level of the recent decline from the $68,240 swing high to the $65,458 low.
Bitcoin price is now trading below $66,500 and the 100 hourly Simple moving average. If there is a fresh increase, the price could face resistance near the $66,150 level.
The first key resistance is near the $66,800 level and the 50% Fib retracement level of the recent decline from the $68,240 swing high to the $65,458 low. A clear move above the $66,800 resistance might spark another increase in the coming sessions.
The next key resistance could be $67,100. The next major hurdle sits at $67,200. A close above the $67,200 resistance might push the price further higher. In the stated case, the price could rise and test the $68,000 resistance.
If Bitcoin fails to climb above the $67,200 resistance zone, it could continue to move down. Immediate support on the downside is near the $65,500 level.
The first major support is $65,080. The next support is now near $64,200. Any more losses might send the price toward the $63,500 support zone in the near term.
Technical indicators:
Hourly MACD – The MACD is now gaining pace in the bearish zone.
Hourly RSI (Relative Strength Index) – The RSI for BTC/USD is now below the 50 level.
Major Support Levels – $65,500, followed by $65,000.
Major Resistance Levels – $67,200, and $68,000.
—
Blog powered by G6
Disclaimer! A guest author has made this post. G6 has not checked the post. its content and attachments and under no circumstances will G6 be held responsible or liable in any way for any claims, damages, losses, expenses, costs or liabilities whatsoever (including, without limitation, any direct or indirect damages for loss of profits, business interruption or loss of information) resulting or arising directly or indirectly from your use of or inability to use this website or any websites linked to it, or from your reliance on the information and material on this website, even if the G6 has been advised of the possibility of such damages in advance.
For any inquiries, please contact [email protected]


