Bitcoin price took a hit and even spiked below $60,000. BTC could gain bearish momentum if there is a daily close below the $60,000 support zone.
Bitcoin started another decline and traded below the $61,200 zone.
The price is trading below $62,000 and the 100 hourly Simple moving average.
There is a connecting bearish trend line forming with resistance at $60,400 on the hourly chart of the BTC/USD pair (data feed from Kraken).
The pair could accelerate lower if it fails to recover above $60,400 and then $62,000 this week.
Bitcoin price started another decline below the $62,500 support level. BTC dropped below the $61,200 level as the bears took control. They even managed to push the price below $60,000.
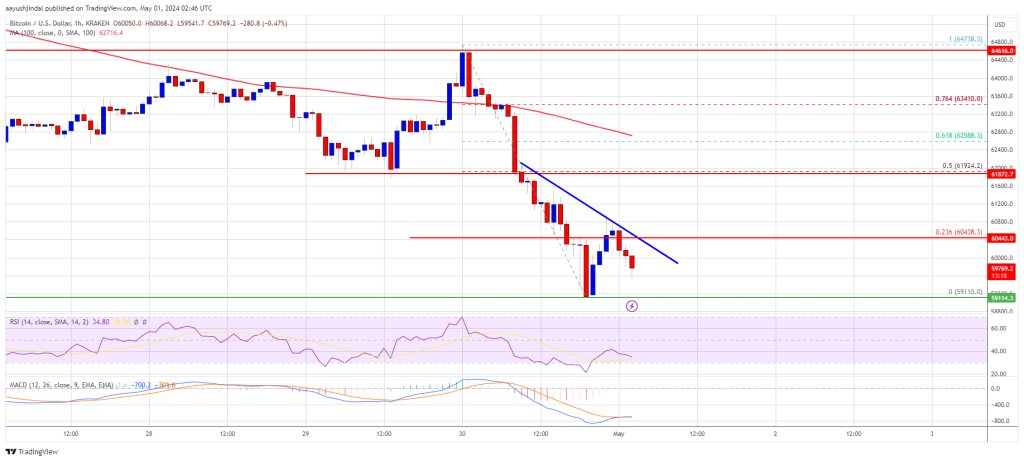
A low was formed at $59,110 and the price is now consolidating losses. There was a minor increase above the $60,000 level and the 23.6% Fib retracement level of the recent decline from the $64,738 swing high to the $59,110 low.
Bitcoin is now trading below $61,500 and the 100 hourly Simple moving average. Immediate resistance is near the $60,400 level. There is also a connecting bearish trend line forming with resistance at $60,400 on the hourly chart of the BTC/USD pair.
The first major resistance could be $61,200. The next key resistance could be $62,000 or the 50% Fib retracement level of the recent decline from the $64,738 swing high to the $59,110 low.
Source: BTCUSD on TradingView.com
A clear move above the $62,000 resistance might send the price higher. The next resistance now sits at $62,500. If there is a clear move above the $62,500 resistance zone, the price could continue to move up. In the stated case, the price could rise toward $64,000.
If Bitcoin fails to rise above the $60,400 resistance zone, it could continue to move down. Immediate support on the downside is near the $59,500 level.
The first major support is $59,100. If there is a close below $59,100, the price could start to drop toward $58,000. Any more losses might send the price toward the $56,400 support zone in the near term.
Technical indicators:
Hourly MACD – The MACD is now gaining pace in the bearish zone.
Hourly RSI (Relative Strength Index) – The RSI for BTC/USD is now below the 50 level.
Major Support Levels – $59,500, followed by $59,100.
Major Resistance Levels – $60,400, $61,200, and $62,000.
—
Blog powered by G6
Disclaimer! A guest author has made this post. G6 has not checked the post. its content and attachments and under no circumstances will G6 be held responsible or liable in any way for any claims, damages, losses, expenses, costs or liabilities whatsoever (including, without limitation, any direct or indirect damages for loss of profits, business interruption or loss of information) resulting or arising directly or indirectly from your use of or inability to use this website or any websites linked to it, or from your reliance on the information and material on this website, even if the G6 has been advised of the possibility of such damages in advance.
For any inquiries, please contact [email protected]


