Bitcoin price climbed further higher above $21,000. BTC is rising and might aim a move towards the $22,000 resistance zone in the near term.
Bitcoin climbed further higher above the $20,000 and $20,500 resistance levels.
The price is trading above $20,200 and the 100 hourly simple moving average.
There is a major bullish trend line forming with support near $20,500 on the hourly chart of the BTC/USD pair (data feed from Kraken).
The pair could rise further above the $21,500 resistance zone in the near term.
Bitcoin price gained a strong bullish momentum and settled above the $20,000 resistance zone. BTC even climbed above the $20,500 level to move into a positive zone.
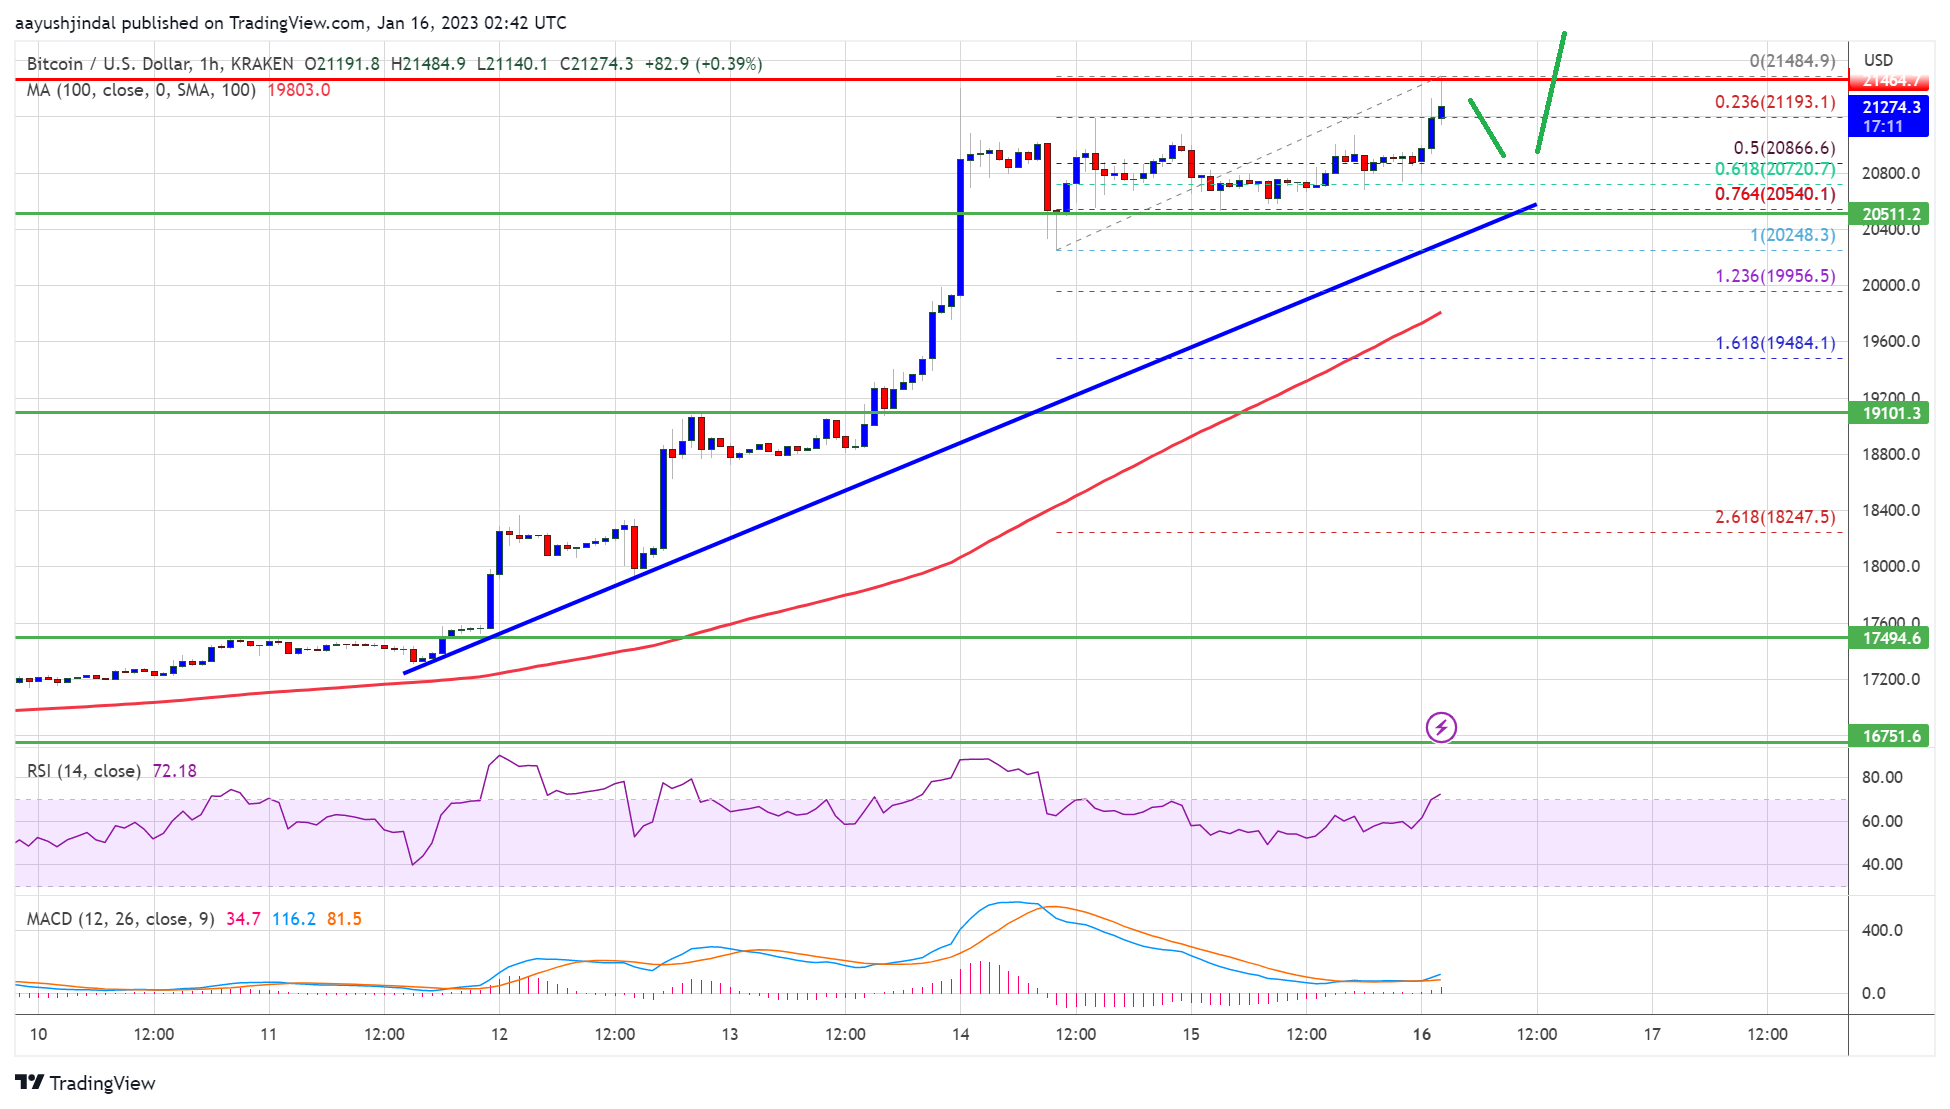
The price consolidated for some time above the $20,500 level. A high is formed near $21,484 and the price is now showing signs of more upsides. It is now trading above $20,200 and the 100 hourly simple moving average. There is also a major bullish trend line forming with support near $20,500 on the hourly chart of the BTC/USD pair.
It is also trading above the 23.6% Fib retracement level of the upward move from the $20,248 swing low to $21,484 high. On the upside, an immediate resistance is near the $21,500 level.
Source: BTCUSD on TradingView.com
The next major resistance is near the $21,850 zone, above which the price might start another steady increase. In the stated case, the price may perhaps rise towards the $22,000 level. Any more gains might send btc price towards the $22,500 level.
If bitcoin price fails to clear the $21,500 resistance, it could start a downside correction. An immediate support on the downside is near the $21,000 level.
The next major support is near the $20,500 level and the trend line. It is near the 61.8% Fib retracement level of the upward move from the $20,248 swing low to $21,484 high. The main support is now forming near the $20,200 level, below which the price might retest $19,000.
Technical indicators:
Hourly MACD – The MACD is now gaining pace in the bullish zone.
Hourly RSI (Relative Strength Index) – The RSI for BTC/USD is now above the 50 level.
Major Support Levels – $20,500, followed by $20,200.
Major Resistance Levels – $21,500, $22,000 and $22,500.
—
Blog powered by G6
Disclaimer! A guest author has made this post. G6 has not checked the post. its content and attachments and under no circumstances will G6 be held responsible or liable in any way for any claims, damages, losses, expenses, costs or liabilities whatsoever (including, without limitation, any direct or indirect damages for loss of profits, business interruption or loss of information) resulting or arising directly or indirectly from your use of or inability to use this website or any websites linked to it, or from your reliance on the information and material on this website, even if the G6 has been advised of the possibility of such damages in advance.
For any inquiries, please contact [email protected]


