Bitcoin is attempting to build a short-term recovery after weeks of sustained selling pressure. Although buyers have defended a key support zone, the broader trend remains fragile as price continues to trade beneath major technical resistance levels that must be cleared first to expect a genuine recovery.
The daily chart continues to reflect a bearish market structure, with BTC trading around $62.1K. The price remains well below both the 100-day and 200-day moving averages, which are now acting as dynamic resistance around the $71K to $75K region. As long as BTC remains beneath these averages, sellers are likely to maintain control.
Following the sharp breakdown below the 100-day moving average near $72K earlier this month, the market found demand within the $60K support zone. This area has once again prevented a deeper decline and is currently fueling a modest rebound. The RSI has also formed a bullish divergence, with higher lows while price recorded lower lows, indicating that bearish momentum is fading and a short-term recovery is possible.
However, the broader trend remains bearish. Even if buyers extend the current bounce, the first major obstacle lies between $72K and $75K, where previous support has turned into resistance alongside both moving averages. A successful recovery above this region would improve the medium-term outlook, while rejection could expose the $60k support once again. Losing that area would likely open the door toward the next major demand zone around $55K.
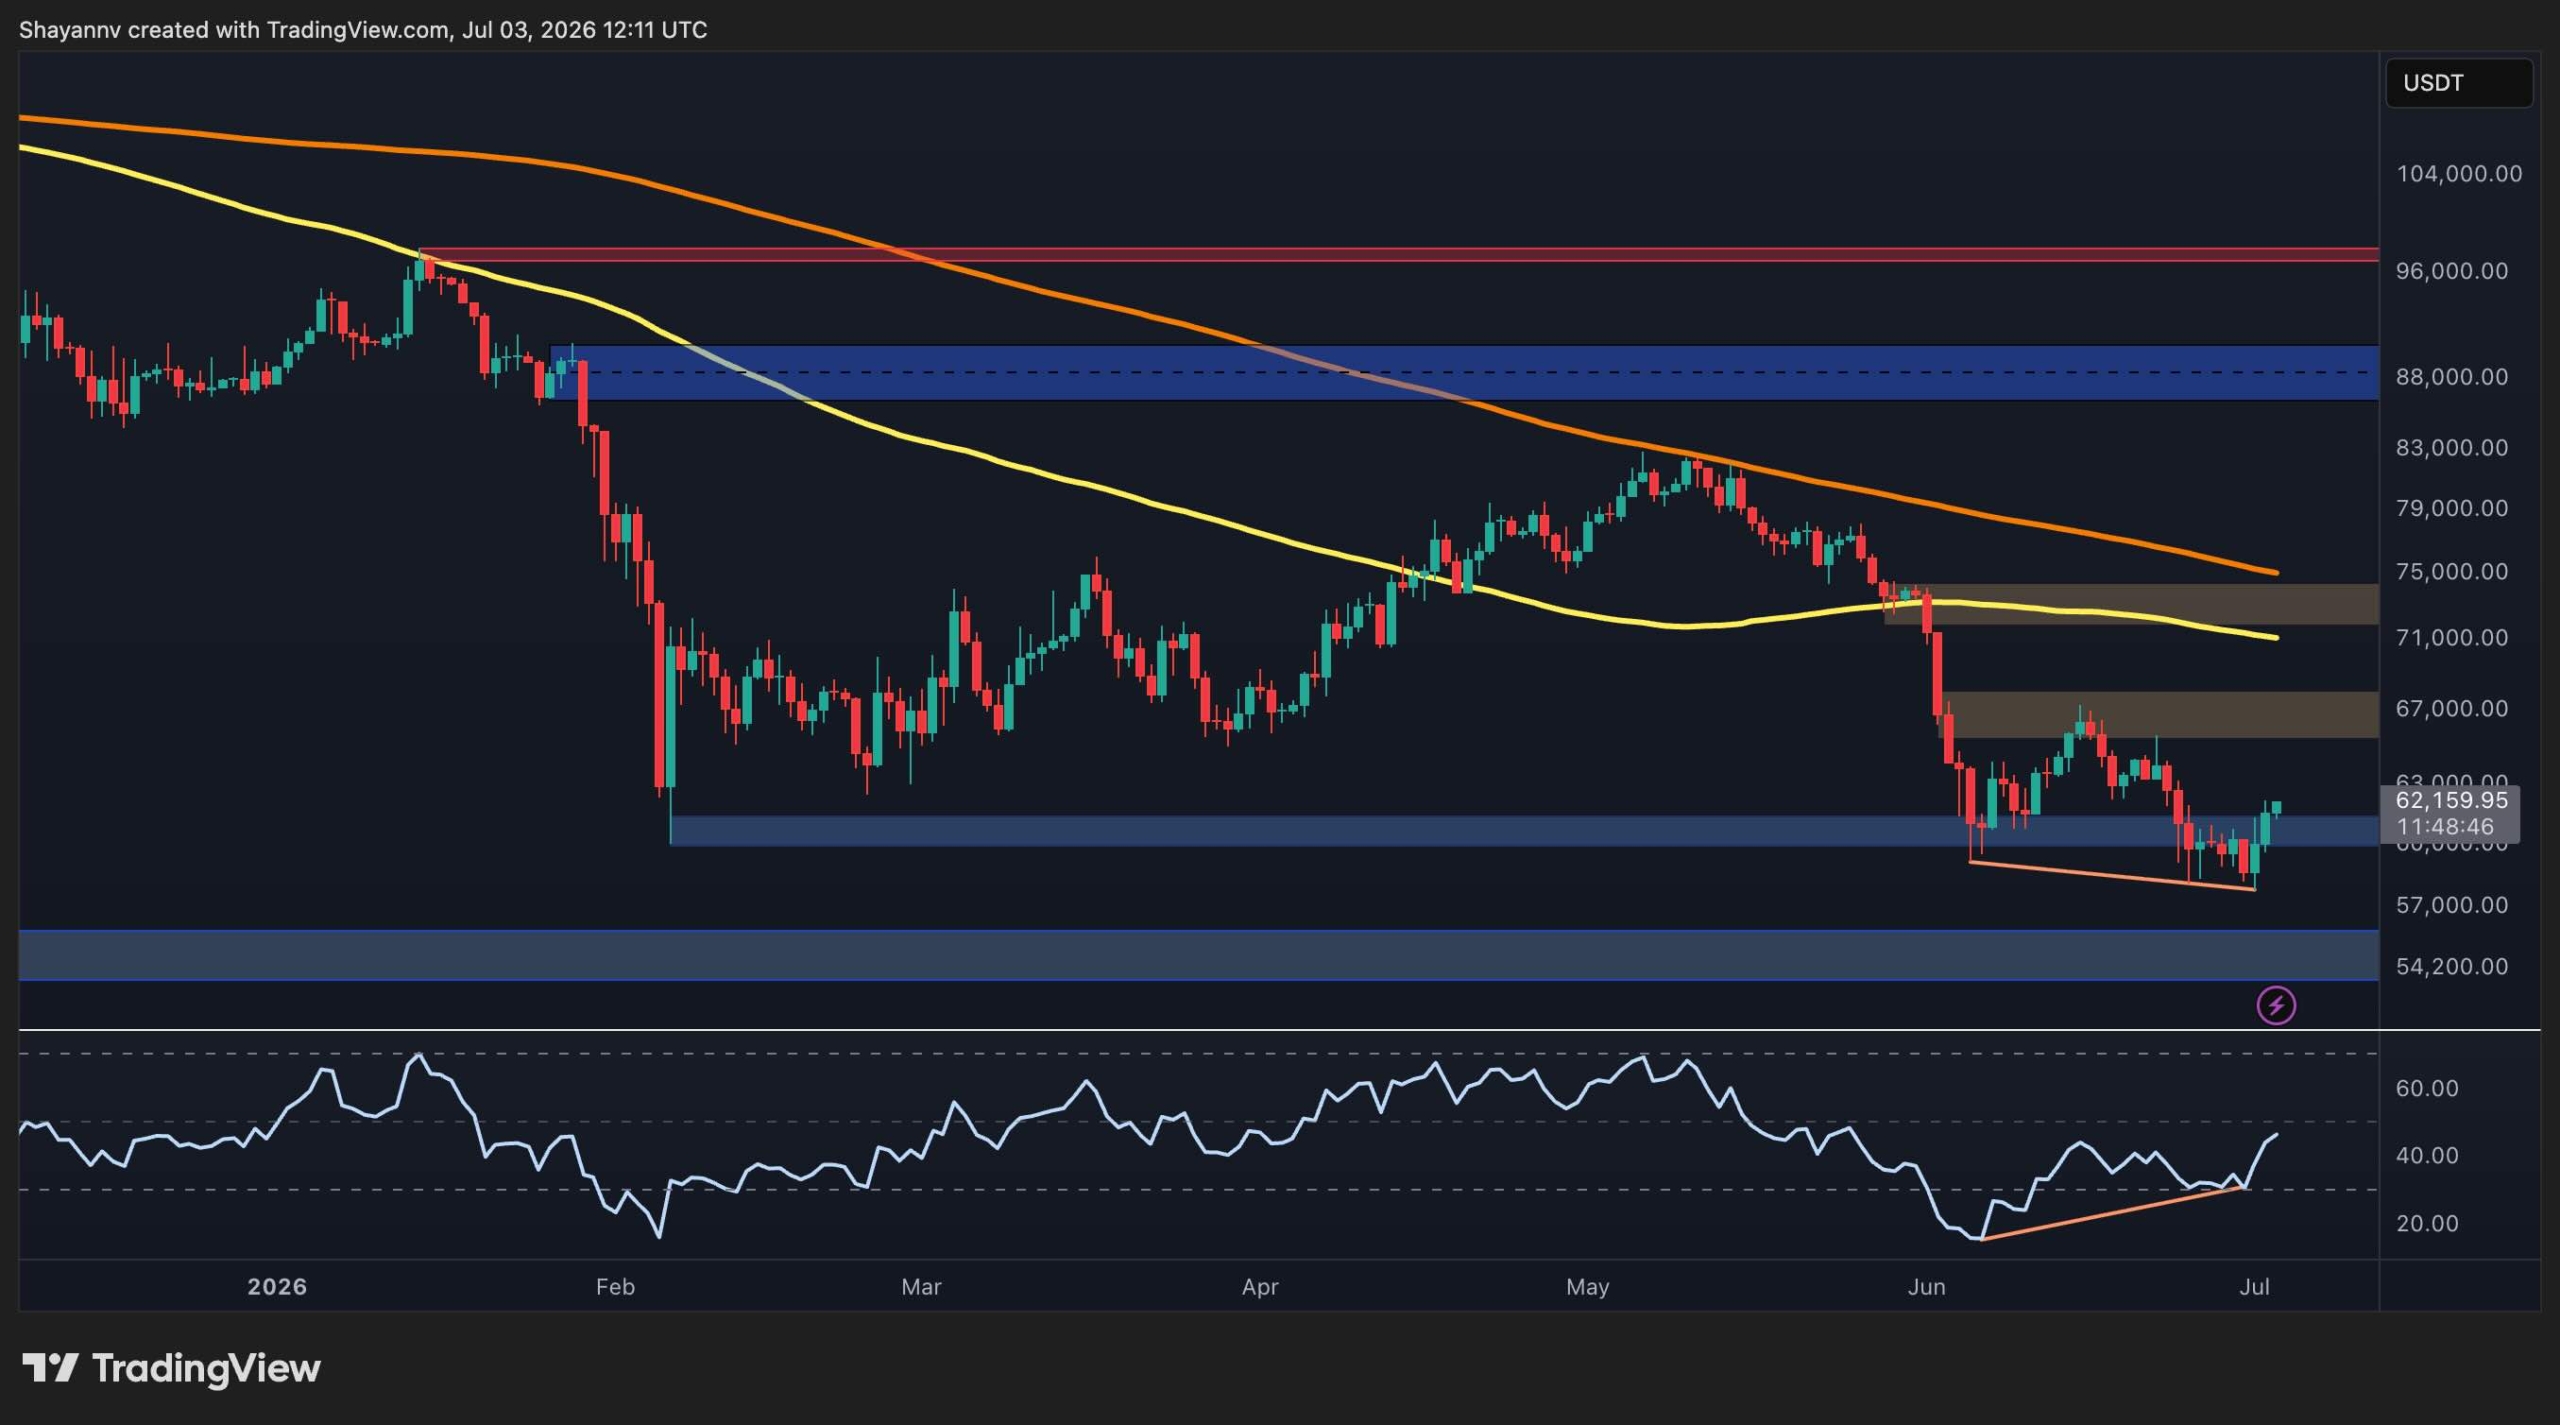
The 4-hour timeframe presents a more constructive picture. Bitcoin has been trading inside a broad falling wedge following the sharp June sell-off, a pattern that often precedes bullish reversals when confirmed by a breakout.
Price has recently rebounded from the wedge’s lower boundary and the $60K support zone. At the same time, the RSI has produced another bullish divergence, reinforcing the idea that selling pressure is gradually weakening.
The next important hurdle lies near the wedge’s descending upper trendline, which currently aligns with the $62K level. A breakout above this resistance could trigger a stronger recovery toward the $66K to $68K supply zone. Beyond that, the much larger resistance area between $72K and $74K remains the key barrier to any meaningful trend reversal.
Failure to break the wedge would keep the broader bearish structure intact and increase the probability of a drop below the $60K support.

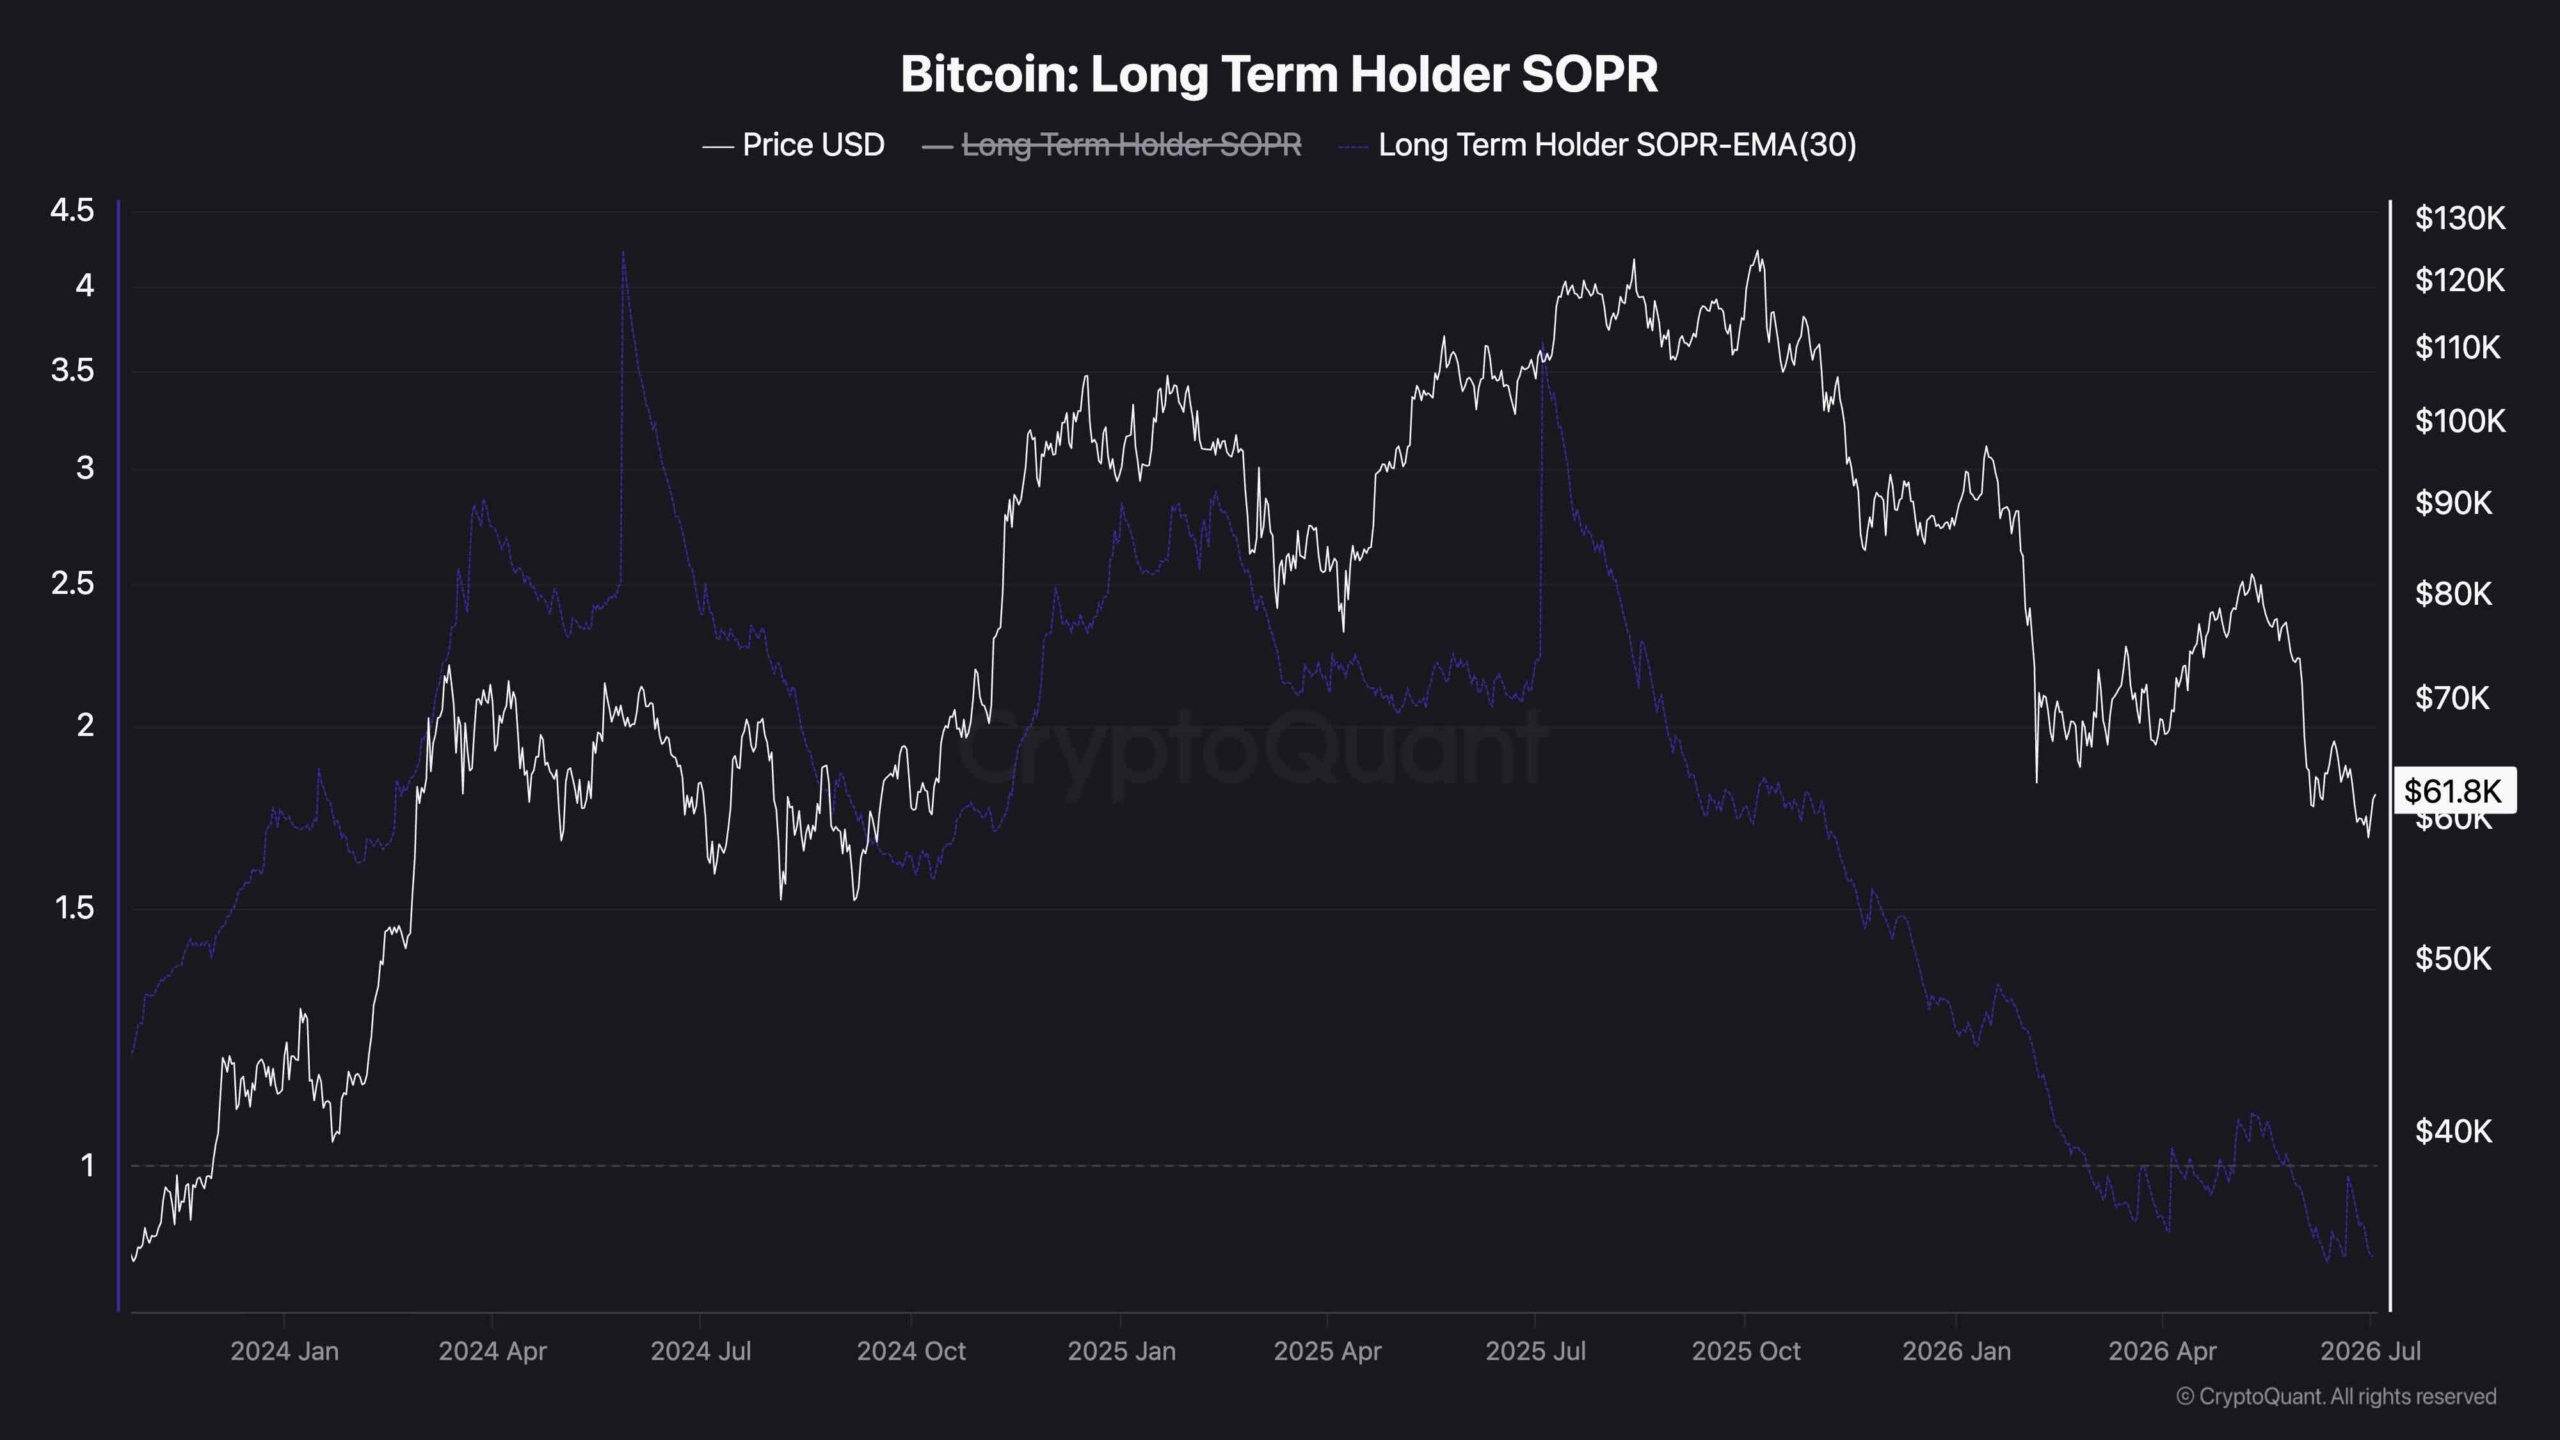
The Long-Term Holder SOPR (Spent Output Profit Ratio) continues to trend below the critical 1.0 threshold, indicating that long-term holders are, on average, realizing losses when spending their coins. Historically, sustained readings below 1.0 reflect periods of market stress, where even experienced investors begin distributing coins at a loss rather than taking profits.
The 30-day EMA of the metric has continued to weaken and now sits below the neutral level, suggesting this behavior has become persistent rather than temporary. This points to subdued investor confidence and confirms that long-term holders have yet to return to meaningful profit-taking.
While this reflects ongoing bearish sentiment, prolonged periods of LTH SOPR below 1.0 have often coincided with the later stages of market corrections, as weaker conviction is gradually exhausted. A recovery of the metric back above 1.0 would signal that long-term holders are once again spending coins in profit, a shift that has historically aligned with improving market conditions and a healthier uptrend. Until then, the on-chain data suggests the broader market remains in a phase of capitulation and recovery rather than a confirmed bullish reversal.
The post Bitcoin Recovery Hinges on Breakout Above $72K Resistance (BTC Price Analysis) appeared first on CryptoPotato.
—
Blog powered by G6
Disclaimer! A guest author has made this post. G6 has not checked the post. its content and attachments and under no circumstances will G6 be held responsible or liable in any way for any claims, damages, losses, expenses, costs or liabilities whatsoever (including, without limitation, any direct or indirect damages for loss of profits, business interruption or loss of information) resulting or arising directly or indirectly from your use of or inability to use this website or any websites linked to it, or from your reliance on the information and material on this website, even if the G6 has been advised of the possibility of such damages in advance.
For any inquiries, please contact [email protected]