Bitcoin edged higher today, breaching the key $119,000 mark, after a string of steady sessions, lifting prices above recent ranges and drawing fresh attention from big investors.
According to Coinglass data, BTC rose about 2.50% in the last 24 hours, and is up 8% over the last seven days. Trading activity and inflows are being watched closely as traders size up the next move.
Data shows the top crypto asset registered a second straight day of strong inflows, putting $430 million into Bitcoin spot ETFs. That kind of demand helps explain why Bitcoin’s market value has jumped from $870 billion to $2.34 trillion this year.
Analysts say that steady institutional buying has been a key engine behind the rally, and continued flows could keep momentum alive.
$BTC/usdt DAILY$BTC breaking out of LTF consolidation @ $115k within the HTF ascending channel we’ve been in all of 2025
$130k is the ultimate breakout point and could lead to the cycle blow off top
pic.twitter.com/1J9rSc7BJO
— Satoshi Flipper (@SatoshiFlipper) October 1, 2025
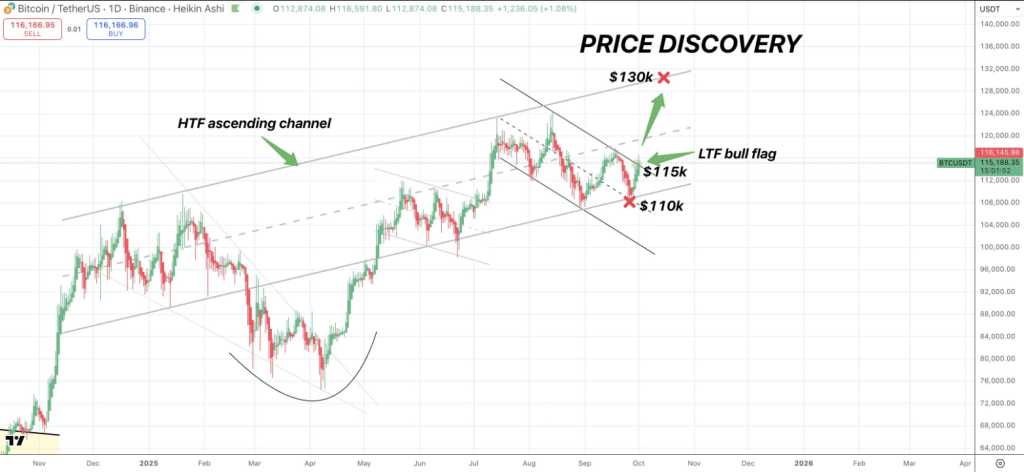
Resistance zones are being tested. Near-term hurdles sit at $118,500 and $119,800, with a close target at $120k if buyers stay in control.
Analyst Satoshi Flipper pointed out that BTC appears to have built a base above the $115,000 area and is holding a higher time frame structure, adding that a long-term breakout aim sits near $130,000.
Buyers extended the climb past $118k, and that move is being cited as a sign that demand remains present above current levels.
On-Chain Signals And Volatility
According to Coinglass, trading volume rose 12% to nearly $95 billion for the day, while Open Interest increased 4.46% to $84 billion.
The OI weighted funding rate came in at 0.0050%. Liquidations show the market can still move quickly: $157.08 million in positions were wiped in the past day, with shorts accounting for $136 million and longs $20 million.
A bullish MACD crossover has been confirmed on some timeframes, and the RSI sits at 58% — levels that suggest more room to climb but not runaway overheated conditions.
Seasonal Patterns Add To The Optimism
Based on reports and past data, October has a history of strong performance — “Uptober” shows an average gain of 20%. September registered a 5% rise, and the third quarter closed with 6% according to Coinglass.
The fourth quarter’s average return has historically been large, at 78%, which is why some market participants are optimistic heading into the final months of the year.
Buyers remain active, but the path up may not be smooth. A clear push above $120,000 would be a useful signal that new highs might follow, while a stumble into the liquidity clusters could force a quick pullback.
Market participants are balancing on-chain flows, visible technical levels, and known seasonal patterns as they decide their next steps.
Featured image from Unsplash, chart from TradingView
—
Blog powered by G6
Disclaimer! A guest author has made this post. G6 has not checked the post. its content and attachments and under no circumstances will G6 be held responsible or liable in any way for any claims, damages, losses, expenses, costs or liabilities whatsoever (including, without limitation, any direct or indirect damages for loss of profits, business interruption or loss of information) resulting or arising directly or indirectly from your use of or inability to use this website or any websites linked to it, or from your reliance on the information and material on this website, even if the G6 has been advised of the possibility of such damages in advance.
For any inquiries, please contact [email protected]