The Chainlink price has impressed at times this year, but it has struggled to mount a sustained bullish run over the past few months. Most recently, the altcoin demonstrated a strong resurgence by moving from around $13 to just beneath $16 in the first half of June.
However, the Chainlink price soon suffered a severe downturn, reaching as low as $11.2 by June 22. While the price of the LINK token has recovered above the $13 level, below are two of the critical levels investors should watch out for over the coming weeks.
In a recent post on the social media platform X, prominent crypto analyst Ali Martinez shared an interesting on-chain insight into the current setup of the Chainlink price. According to the market pundit, the altcoin could be approaching a critical resistance level around the $15 region.
This on-chain revelation is based on the average cost basis of several LINK investors. For context, cost-basis analysis examines a level’s capacity to function as support or resistance based on the volume of tokens last acquired by investors in the price region.
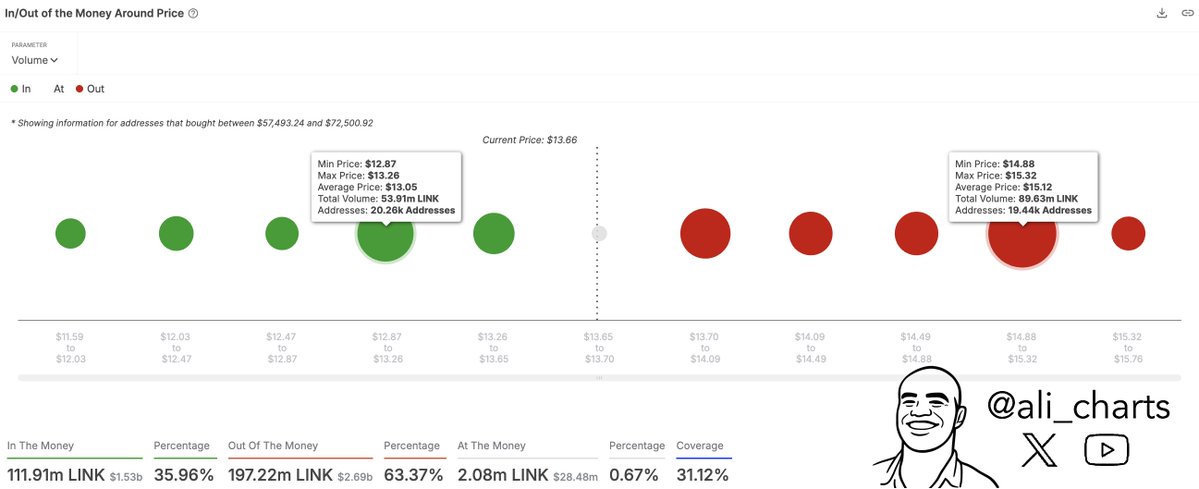
As depicted in the chart above, the size of the dot represents the amount of LINK tokens purchased within each price region and its corresponding strength. The bigger the dot, the larger the volume of purchased tokens, and the stronger the support or resistance. It is worth noting that the green dots are the support levels, as they are below the current price, while the red dots refer to resistance, as they are above the current price.
According to data highlighted by Martinez, the Chainlink price faces a major supply barrier around the $14.88 – $15.32 region, where 10,440 addresses bought 89.63 million LINK tokens (equivalent $1.36 billion at an average price of $15.12). This region could prove to be a resistance to price, as investors with their cost basis around the level would likely sell as soon as they break even, thereby putting downward pressure on the LINK price.
Furthermore, IntoTheBlock data shows that the Chainlink price could find significant support around the $12.87 – $13.26 bracket, where 20,260 investors acquired 53.91 million LINK tokens at an average price of $13.05. The rationale behind this is that, when LINK’s price returns to around $12.8, investors with their cost basis in and around this level are likely to defend their position by purchasing more coins, ensuring the altcoin stays above the support area.
As of this writing, the LINK token is valued at around $13.16, reflecting an almost 4% price decline in the past 24 hours.
—
Blog powered by G6
Disclaimer! A guest author has made this post. G6 has not checked the post. its content and attachments and under no circumstances will G6 be held responsible or liable in any way for any claims, damages, losses, expenses, costs or liabilities whatsoever (including, without limitation, any direct or indirect damages for loss of profits, business interruption or loss of information) resulting or arising directly or indirectly from your use of or inability to use this website or any websites linked to it, or from your reliance on the information and material on this website, even if the G6 has been advised of the possibility of such damages in advance.
For any inquiries, please contact [email protected]