Dogecoin is gaining pace above the $0.085 resistance against the US Dollar. DOGE could rise further if there is a close above the $0.092 resistance.
DOGE gained pace and traded above the $0.085 resistance against the US dollar.
The price is trading above the $0.0850 zone and the 100 simple moving average (4-hours).
There is a major bullish trend line forming with support near $0.0830 on the 4-hours chart of the DOGE/USD pair (data source from Kraken).
The pair could rise further if there is a clear close above the $0.092 resistance.
After forming a base above the $0.065 zone, dogecoin price started a steady increase. DOGE remained well bid and gained pace above the $0.075 resistance.
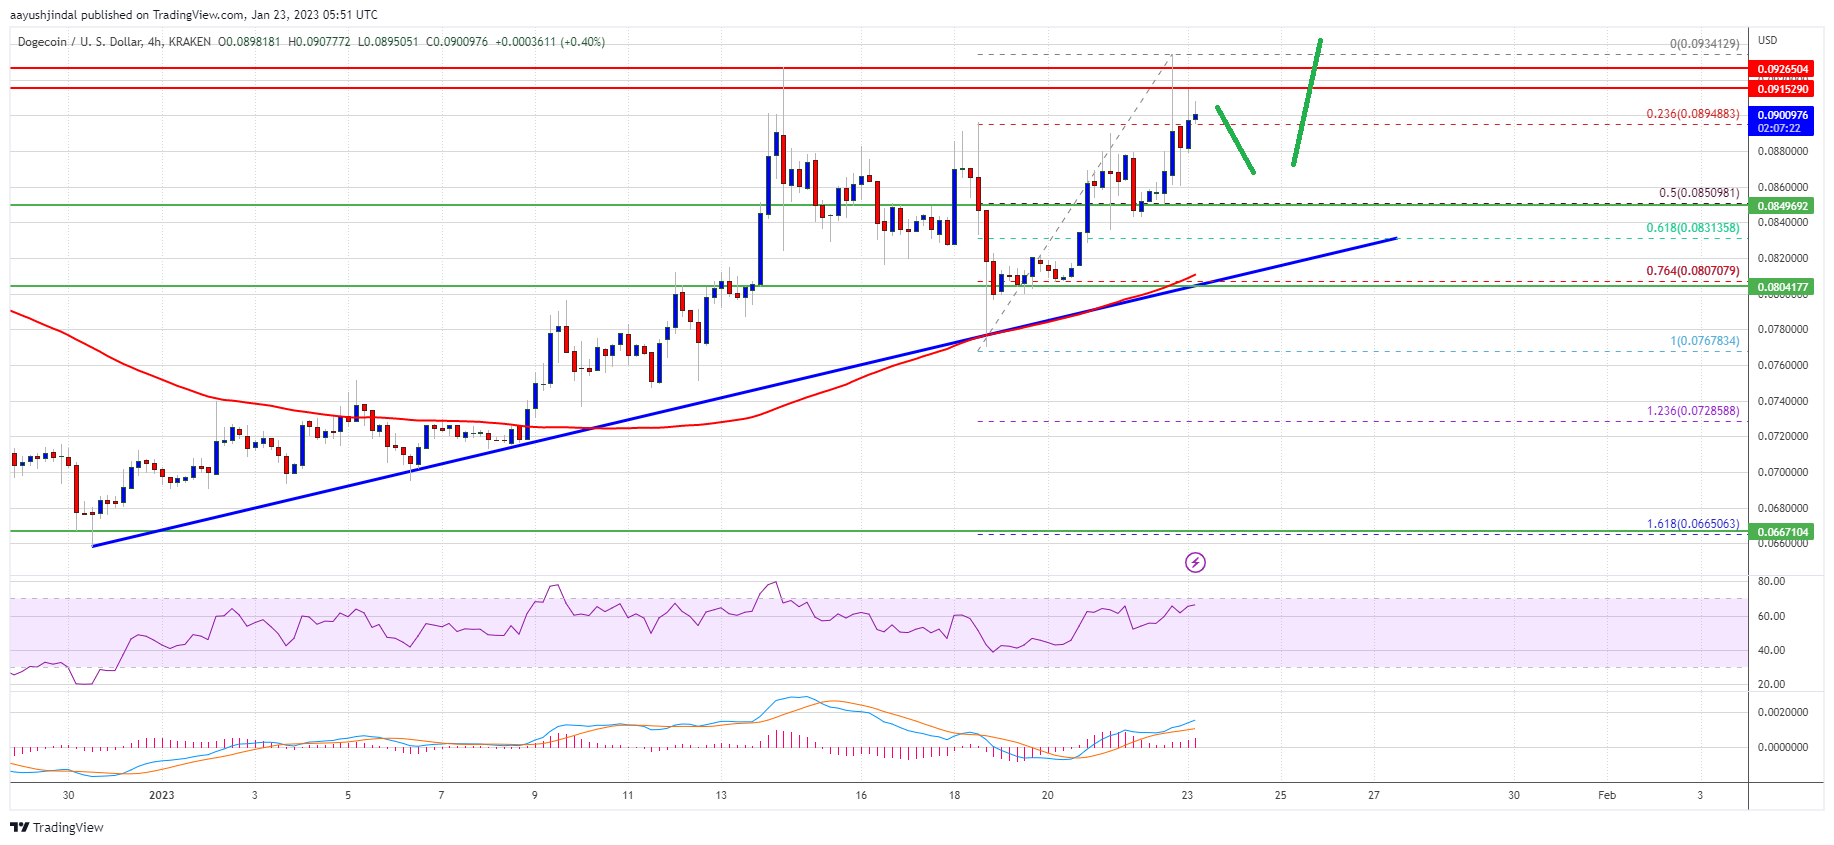
There was a clear move above the $0.080 resistance zone to start a decent rally. The price surpassed a few hurdles near the $0.085 level and settled above the 100 simple moving average (4-hours), similar to bitcoin and ethereum. A new yearly high was formed near $0.0934 and the price is now consolidating gains.
It is trading near the 23.6% Fib retracement level of the upward move from the $0.0768 swing low to $0.0934 high. Doge price is now trading above the $0.0850 zone and the 100 simple moving average (4-hours).
There is also a major bullish trend line forming with support near $0.0830 on the 4-hours chart of the DOGE/USD pair. On the upside, the price is facing resistance near the $0.0915 level. The first major resistance is near the $0.0920 level.
Source: DOGEUSD on TradingView.com
A clear move above the $0.092 resistance might send the price towards the $0.098 resistance. Any more gains might send the price towards the $0.100 level. A clear move above the $0.100 resistance could open the gates for a rally towards the $0.112 level.
If DOGE price fails to gain pace above the $0.092 level, it could start a downside correction. An initial support on the downside is near the $0.0880 level.
The next major support is near the $0.085 level or the 50% Fib retracement level of the upward move from the $0.0768 swing low to $0.0934 high. If there is a downside break below the $0.085 support, the price could decline further. In the stated case, the price might decline towards the $0.082 level and the trend line.
Technical Indicators
4-Hours MACD – The MACD for DOGE/USD is now gaining momentum in the bullish zone.
4-Hours RSI (Relative Strength Index) – The RSI for DOGE/USD is now above the 50 level.
Major Support Levels – $0.088, $0.0850 and $0.0820.
Major Resistance Levels – $0.0915, $0.0920 and $0.098.
—
Blog powered by G6
Disclaimer! A guest author has made this post. G6 has not checked the post. its content and attachments and under no circumstances will G6 be held responsible or liable in any way for any claims, damages, losses, expenses, costs or liabilities whatsoever (including, without limitation, any direct or indirect damages for loss of profits, business interruption or loss of information) resulting or arising directly or indirectly from your use of or inability to use this website or any websites linked to it, or from your reliance on the information and material on this website, even if the G6 has been advised of the possibility of such damages in advance.
For any inquiries, please contact [email protected]


