Polkadot (DOT) is showing bearish signs below the $8 resistance against the US Dollar. The price could extend its decline if it fails to stay above $6.00.
DOT is gaining pace below the $8.80 and $8.00 levels against the US Dollar.
The price is trading below the $7.20 zone and the 100 simple moving average (4 hours).
There is a key bearish trend line forming with resistance at $6.50 on the 4-hour chart of the DOT/USD pair (data source from Kraken).
The pair could continue to decline toward the $5.00 support zone.
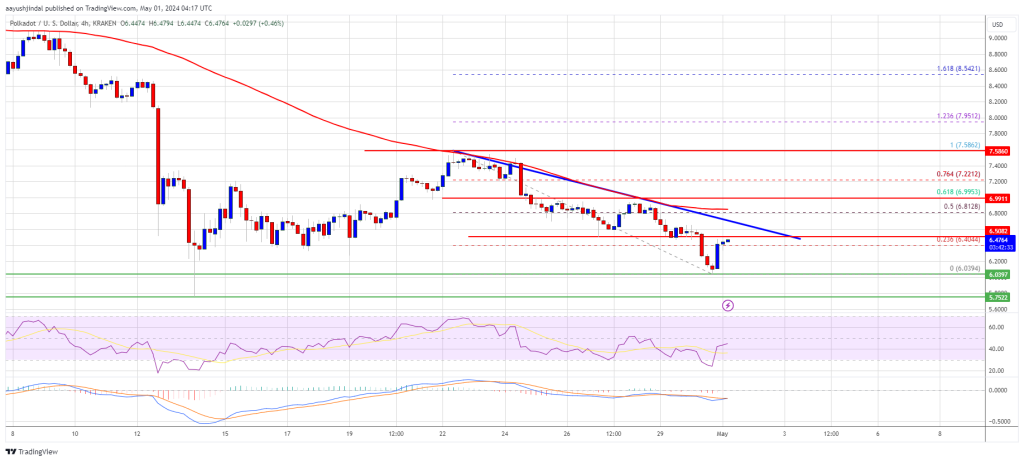
After a steady increase, DOT price faced resistance near the $7.60 zone. It formed a short-term top and started a fresh decline below the $7.00 level, like Ethereum and Bitcoin.
There was a move below the $6.20 support zone. A low was formed near $6.03 and the price is now consolidating losses. It is slowly moving higher above the $6.35 level and the 23.6% Fib retracement level of the downward move from the $7.58 swing high to the $6.03 low.
DOT is now trading below the $7.00 zone and the 100 simple moving average (4 hours). Immediate resistance is near the $6.50 level. There is also a key bearish trend line forming with resistance at $6.50 on the 4-hour chart of the DOT/USD pair.
Source: DOTUSD on TradingView.com
The next major resistance is near $7.00 or the 61.8% Fib retracement level of the downward move from the $7.58 swing high to the $6.03 low. A successful break above $7.00 could start another strong rally. In the stated case, the price could easily rally toward $8.20 in the near term. The next major resistance is seen near the $10.00 zone.
If DOT price fails to start a fresh increase above $7.00, it could continue to move down. The first key support is near the $6.00 level.
The next major support is near the $5.65 level, below which the price might decline to $5.00. Any more losses may perhaps open the doors for a move toward the $4.20 support zone or the trend line.
Technical Indicators
4-Hours MACD – The MACD for DOT/USD is now losing momentum in the bearish zone.
4-Hours RSI (Relative Strength Index) – The RSI for DOT/USD is now below the 50 level.
Major Support Levels – $6.00, $5.65 and $5.00.
Major Resistance Levels – $6.50, $7.00, and $8.50.
—
Blog powered by G6
Disclaimer! A guest author has made this post. G6 has not checked the post. its content and attachments and under no circumstances will G6 be held responsible or liable in any way for any claims, damages, losses, expenses, costs or liabilities whatsoever (including, without limitation, any direct or indirect damages for loss of profits, business interruption or loss of information) resulting or arising directly or indirectly from your use of or inability to use this website or any websites linked to it, or from your reliance on the information and material on this website, even if the G6 has been advised of the possibility of such damages in advance.
For any inquiries, please contact [email protected]


