Ethereum is trading close to $4,500 after a strong weekly gain of more than 13%. Analysts are tracking several bullish chart setups, with projections ranging from $5,500 to almost $7,000 if momentum continues.
Consequently, the focus now is whether ETH can break resistance near its all-time high and move into price discovery.
Titan of Crypto shared a weekly chart showing ETH forming a bull flag. The pattern has developed after a sharp rally from about $2,500 to above $4,500. A bull flag is known as a continuation setup, where the price consolidates downward before resuming higher.
#Ethereum Bull Flag
Weekly bull flag pattern forming on $ETH.
A breakout could send price toward $6,900pic.twitter.com/5DmGqrZifs
— Titan of Crypto (@Washigorira) October 2, 2025
According to the analysis, a confirmed breakout above the flag’s resistance could project a move to around $6,900. The target is based on the height of the previous rally, known as the flagpole, added to the breakout level. ETH is still consolidating, so a clear breakout would be needed before the move is validated.
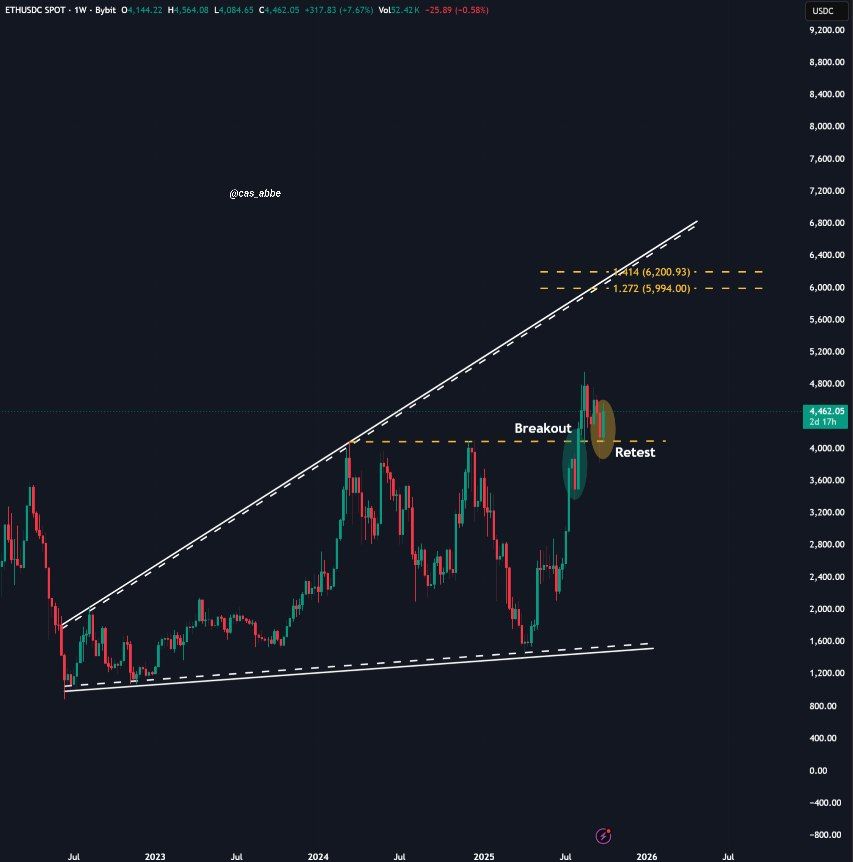
Cas Abbé posted a chart showing ETH breaking and retesting the $4,100–$4,200 zone, which has now turned into support. Retests of this kind are often seen as positive confirmation, especially when paired with strong buying volume.
Cas Abbé wrote,
“Ethereum could go down and retest $4,100–$4,200 level again before a new ATH.”
They also shared a short-term target of between $5,500 and $6,000 by November. Fibonacci extension levels from his chart point to $5,994 and $6,200 as the next upside zones if the support holds.
Merlijn The Trader compared ETH’s performance against Bitcoin on the weekly chart. The pair has been in a long re-accumulation phase since 2018, similar to conditions that preceded Ethereum’s surge in 2017.
ETHEREUM VS BITCOIN IS LOADING ITS BIGGEST ROTATION IN 8 YEARS.
The chart screams re-accumulation.
The signal that preceded $ETH‘s parabolic run in 2017 is back.History doesn’t lie.
This time the move comes with Wall Street fuel. pic.twitter.com/m7iLrsavs1— Merlijn The Trader
Token2049
(@MerlijnTrader) October 2, 2025
The analysis suggests that if ETH/BTC breaks higher, Ethereum could begin a new phase of outperformance, this time with added participation from institutional investors.
CW shared a 3-day ETH/USD chart that places Ethereum just below its prior all-time high between $4,800 and $4,900. ETH has maintained a strong uptrend from the lows of 2022, with the recent pullback looking minor compared to the broader trend.
CW noted,
“$ETH will rise beyond ATH and go to the moon.”
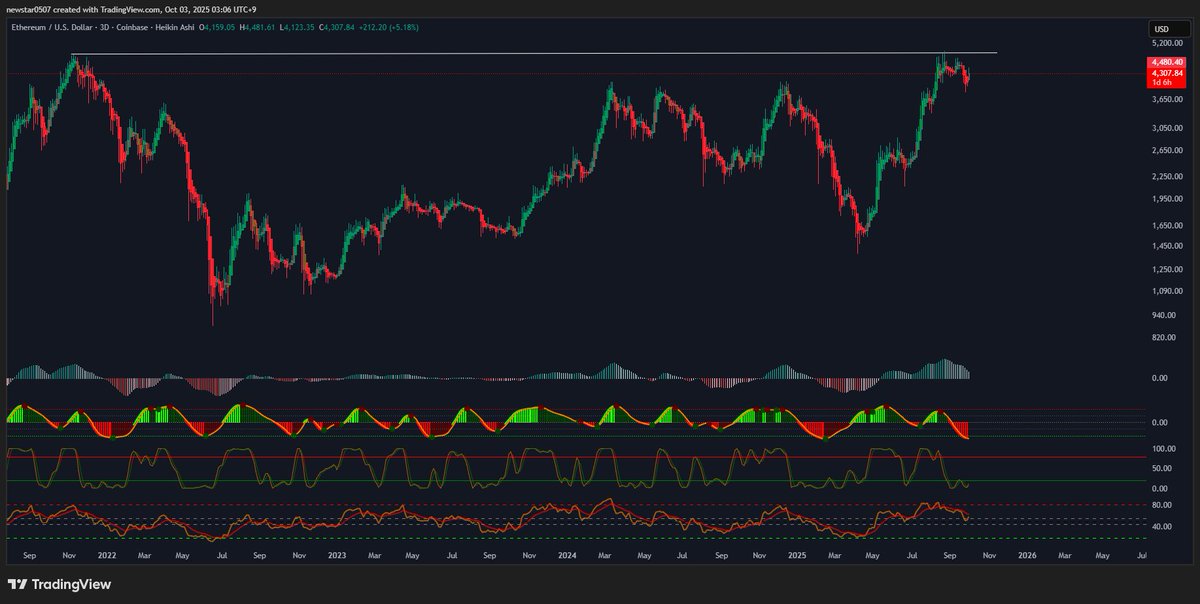
Indicators on the chart show ETH has been overbought in the short term, which may lead to sideways movement or a pause. Still, a breakout above $4,900 would push ETH into new territory with room for further gains.
The post Ethereum Eyes ATH Levels Again, Bull Flag Points to $6,900 Run appeared first on CryptoPotato.
—
Blog powered by G6
Disclaimer! A guest author has made this post. G6 has not checked the post. its content and attachments and under no circumstances will G6 be held responsible or liable in any way for any claims, damages, losses, expenses, costs or liabilities whatsoever (including, without limitation, any direct or indirect damages for loss of profits, business interruption or loss of information) resulting or arising directly or indirectly from your use of or inability to use this website or any websites linked to it, or from your reliance on the information and material on this website, even if the G6 has been advised of the possibility of such damages in advance.
For any inquiries, please contact [email protected]