Ethereum has rebounded strongly from late September lows and is now pressing back toward key resistance levels. The recent move has shifted momentum, but overbought conditions and supply zones could bring short-term challenges.
By Shayan
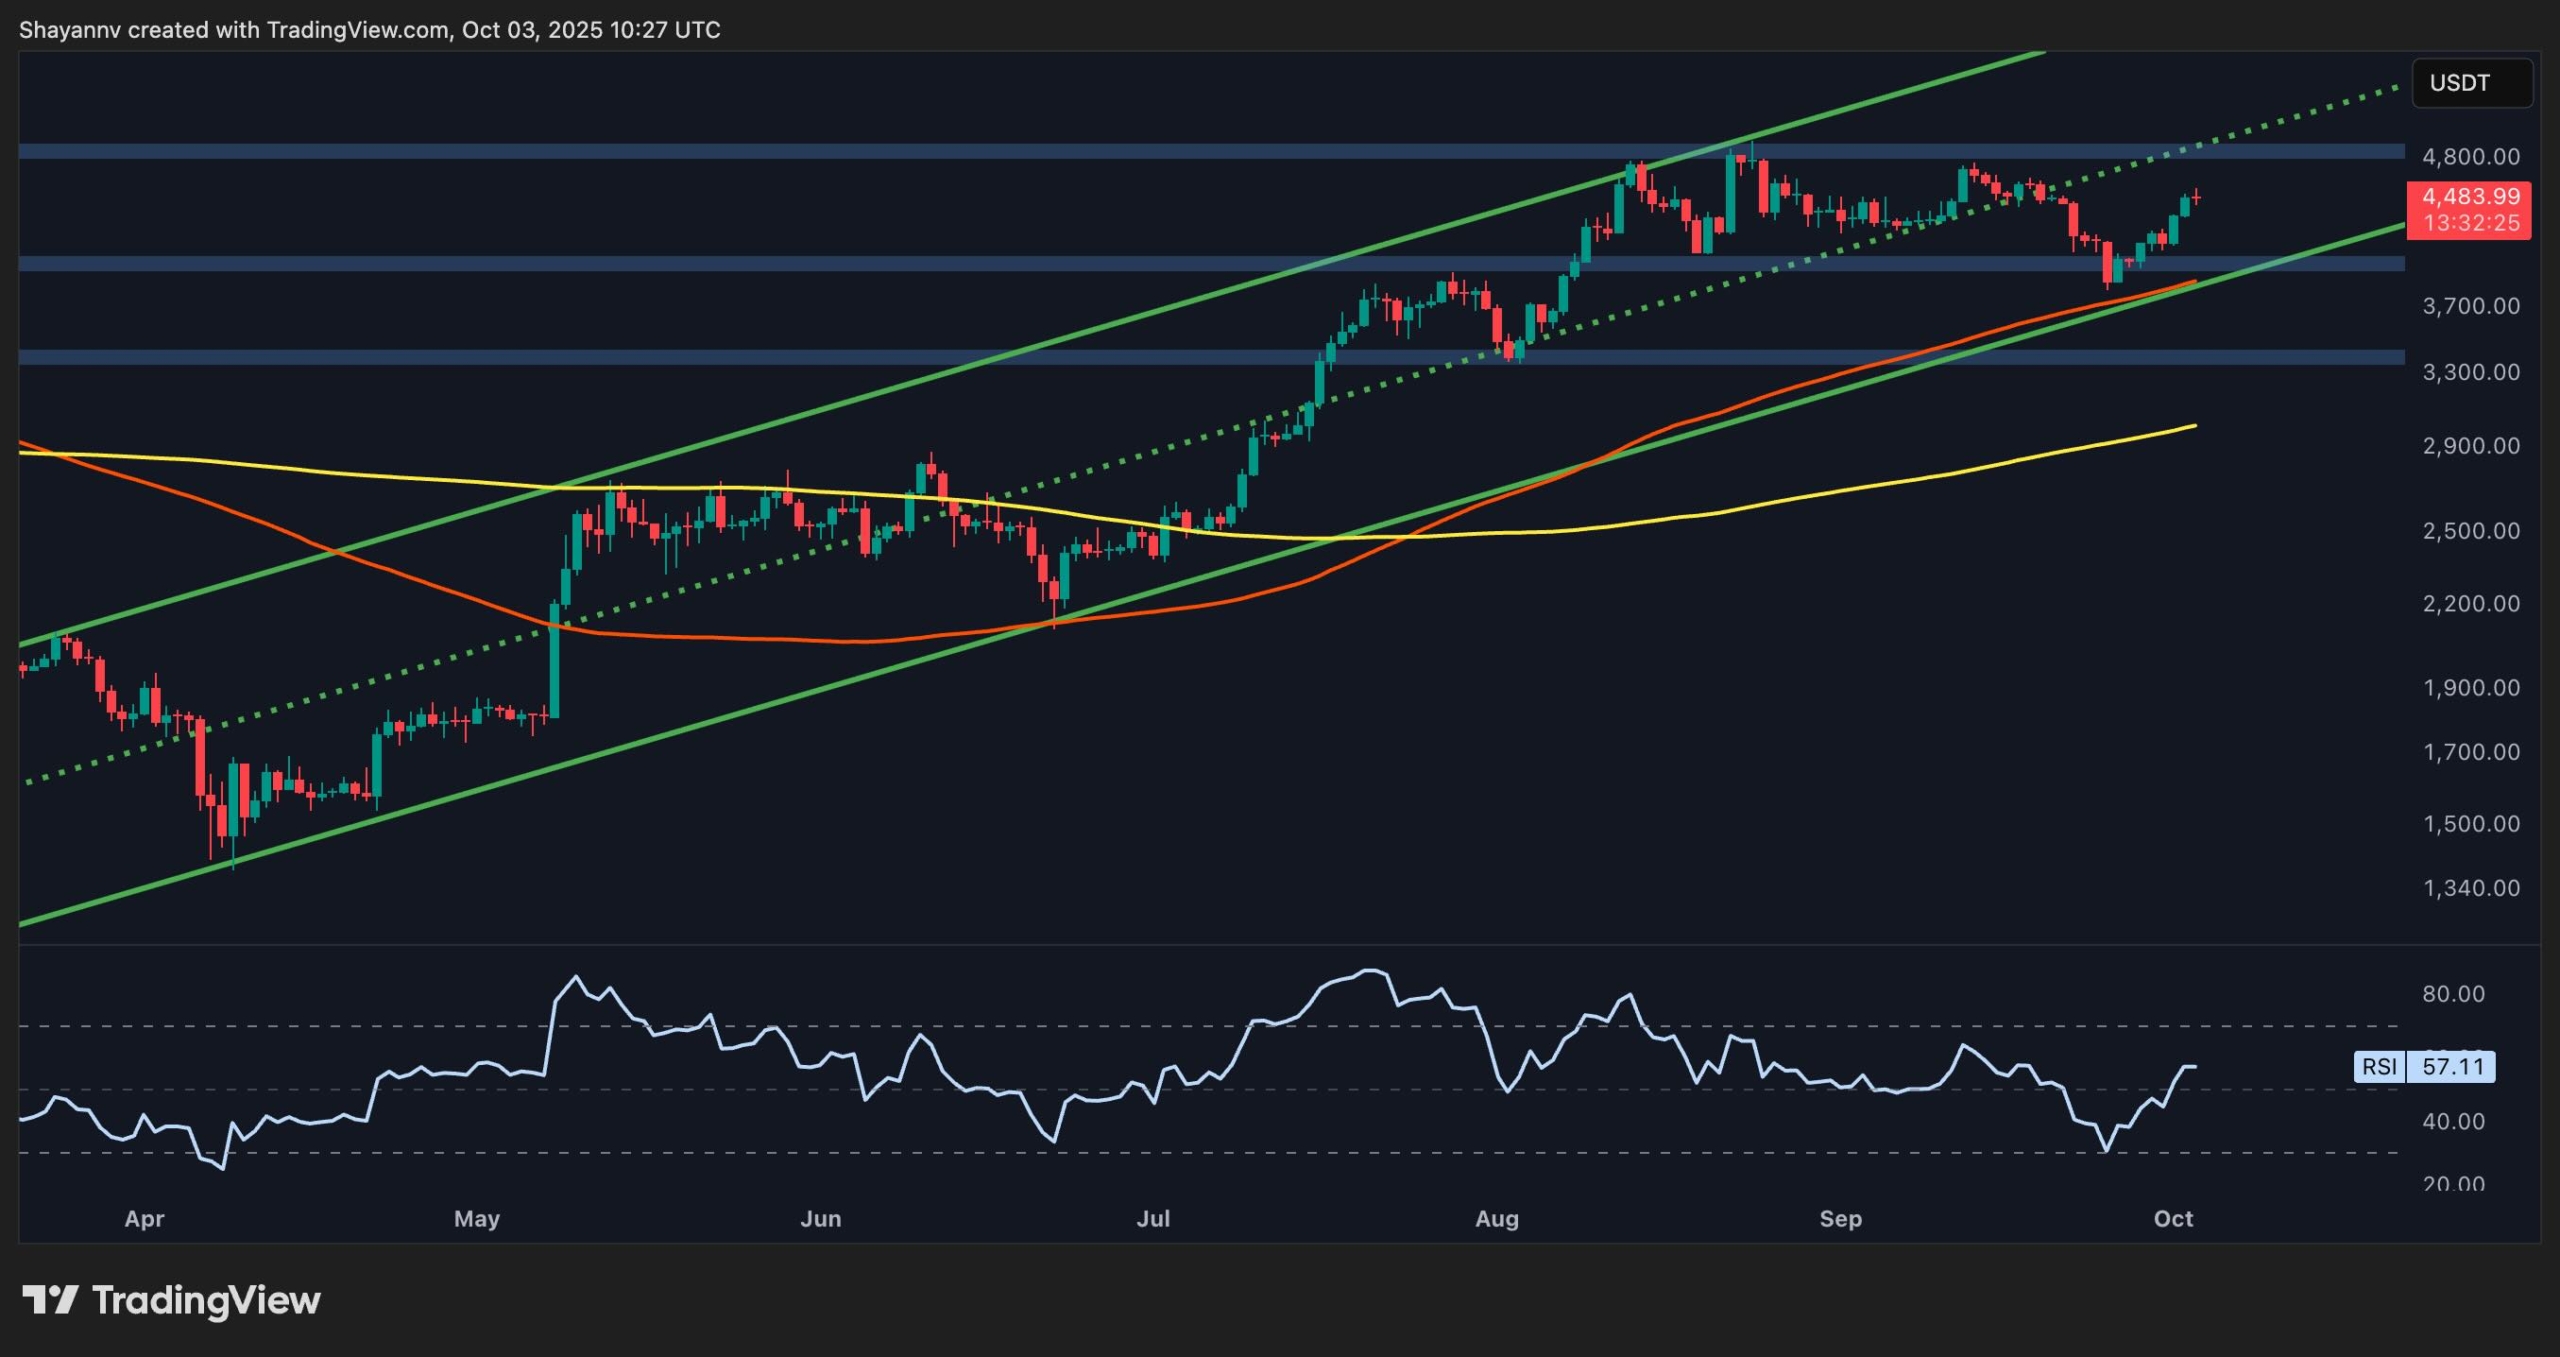
On the daily chart, ETH is trading above $4,500 inside its broader ascending channel. The asset reclaimed the $4,000 support area and pushed higher, but it’s now approaching the $4,800 resistance zone that capped previous rallies.
The RSI stands around 57, still in neutral territory, showing there’s room for continuation if momentum persists. Holding above $4,000 maintains the broader bullish structure, while a daily close above $4,800 would mark a major breakout toward new all-time highs above $ 5,000.
On the other hand, as long as the 100-day moving average, located around the $3,900 mark, is not broken to the downside, the market trend would still remain bullish.
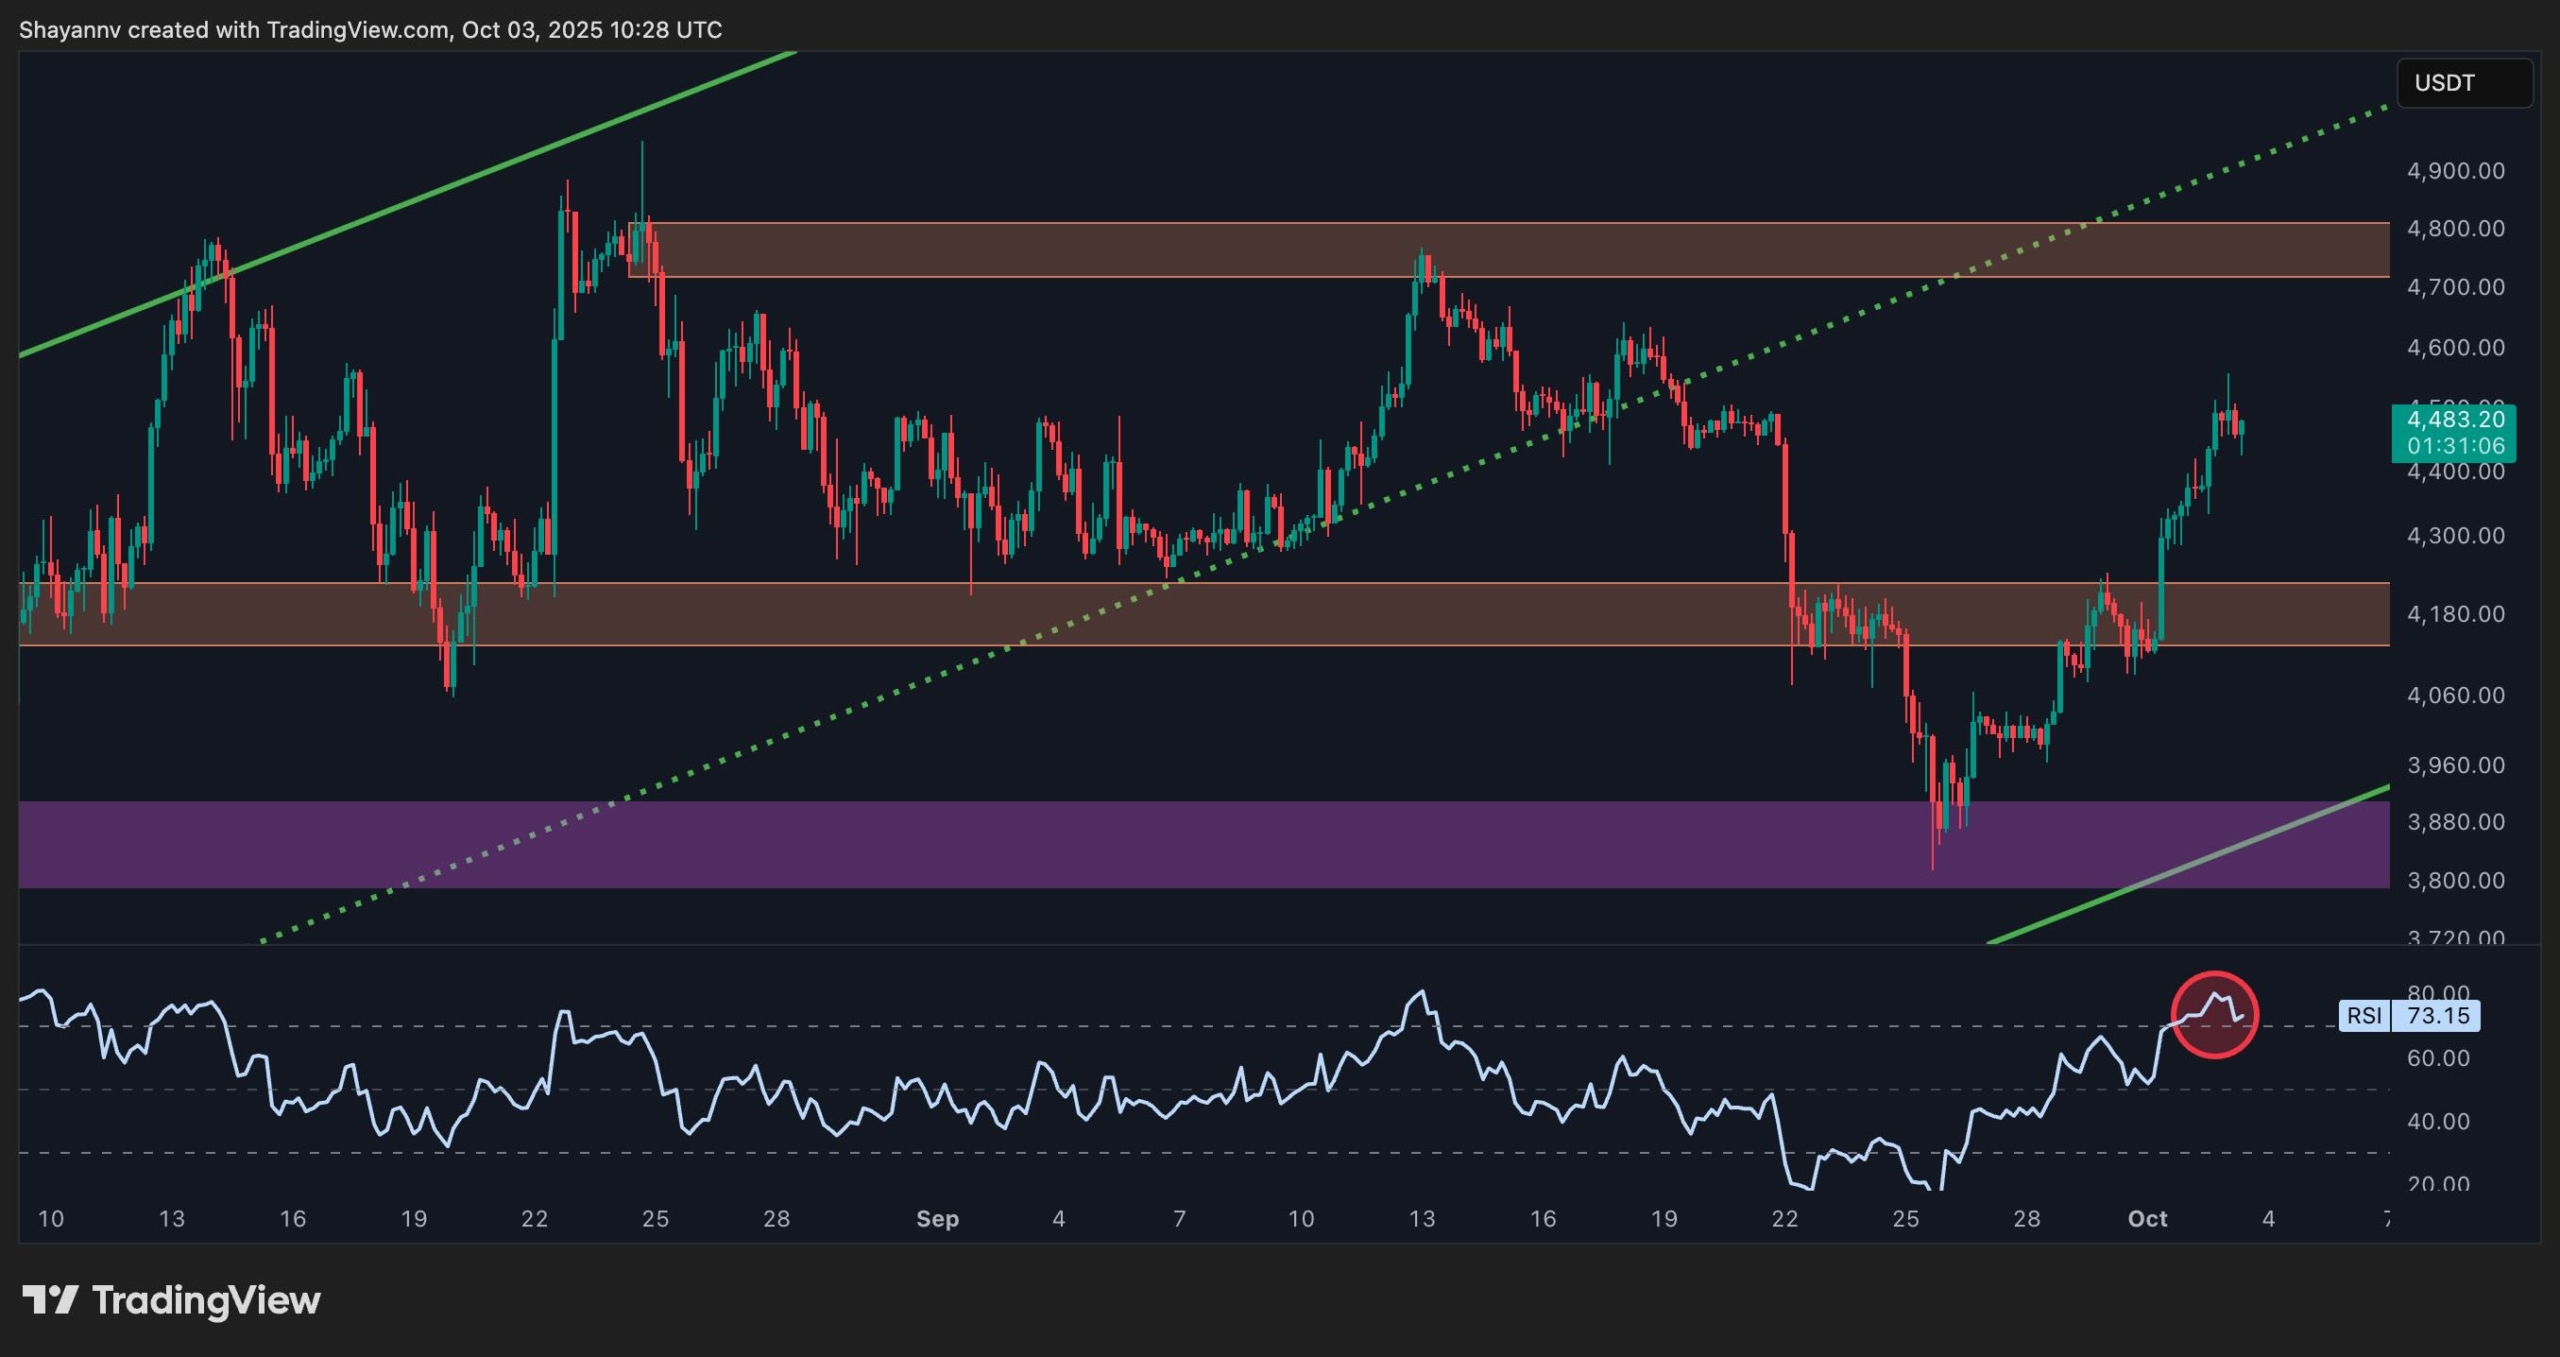
On the 4-hour timeframe, ETH rallied sharply from the $3,900 demand block, reclaiming the $4,200 level and extending gains toward $4,500. RSI spiked into overbought levels above 70, with a minor pullback already visible.
Short-term structure shows strong momentum, but sellers may step in again around the $4,600 supply zone. If the price consolidates above $4,200, ETH could set up another push higher, while failure to hold that level risks a retrace back to $3,900-$4,000 support area. This could lead to a break below the ascending channel, which could shift the overall market structure to bearish.
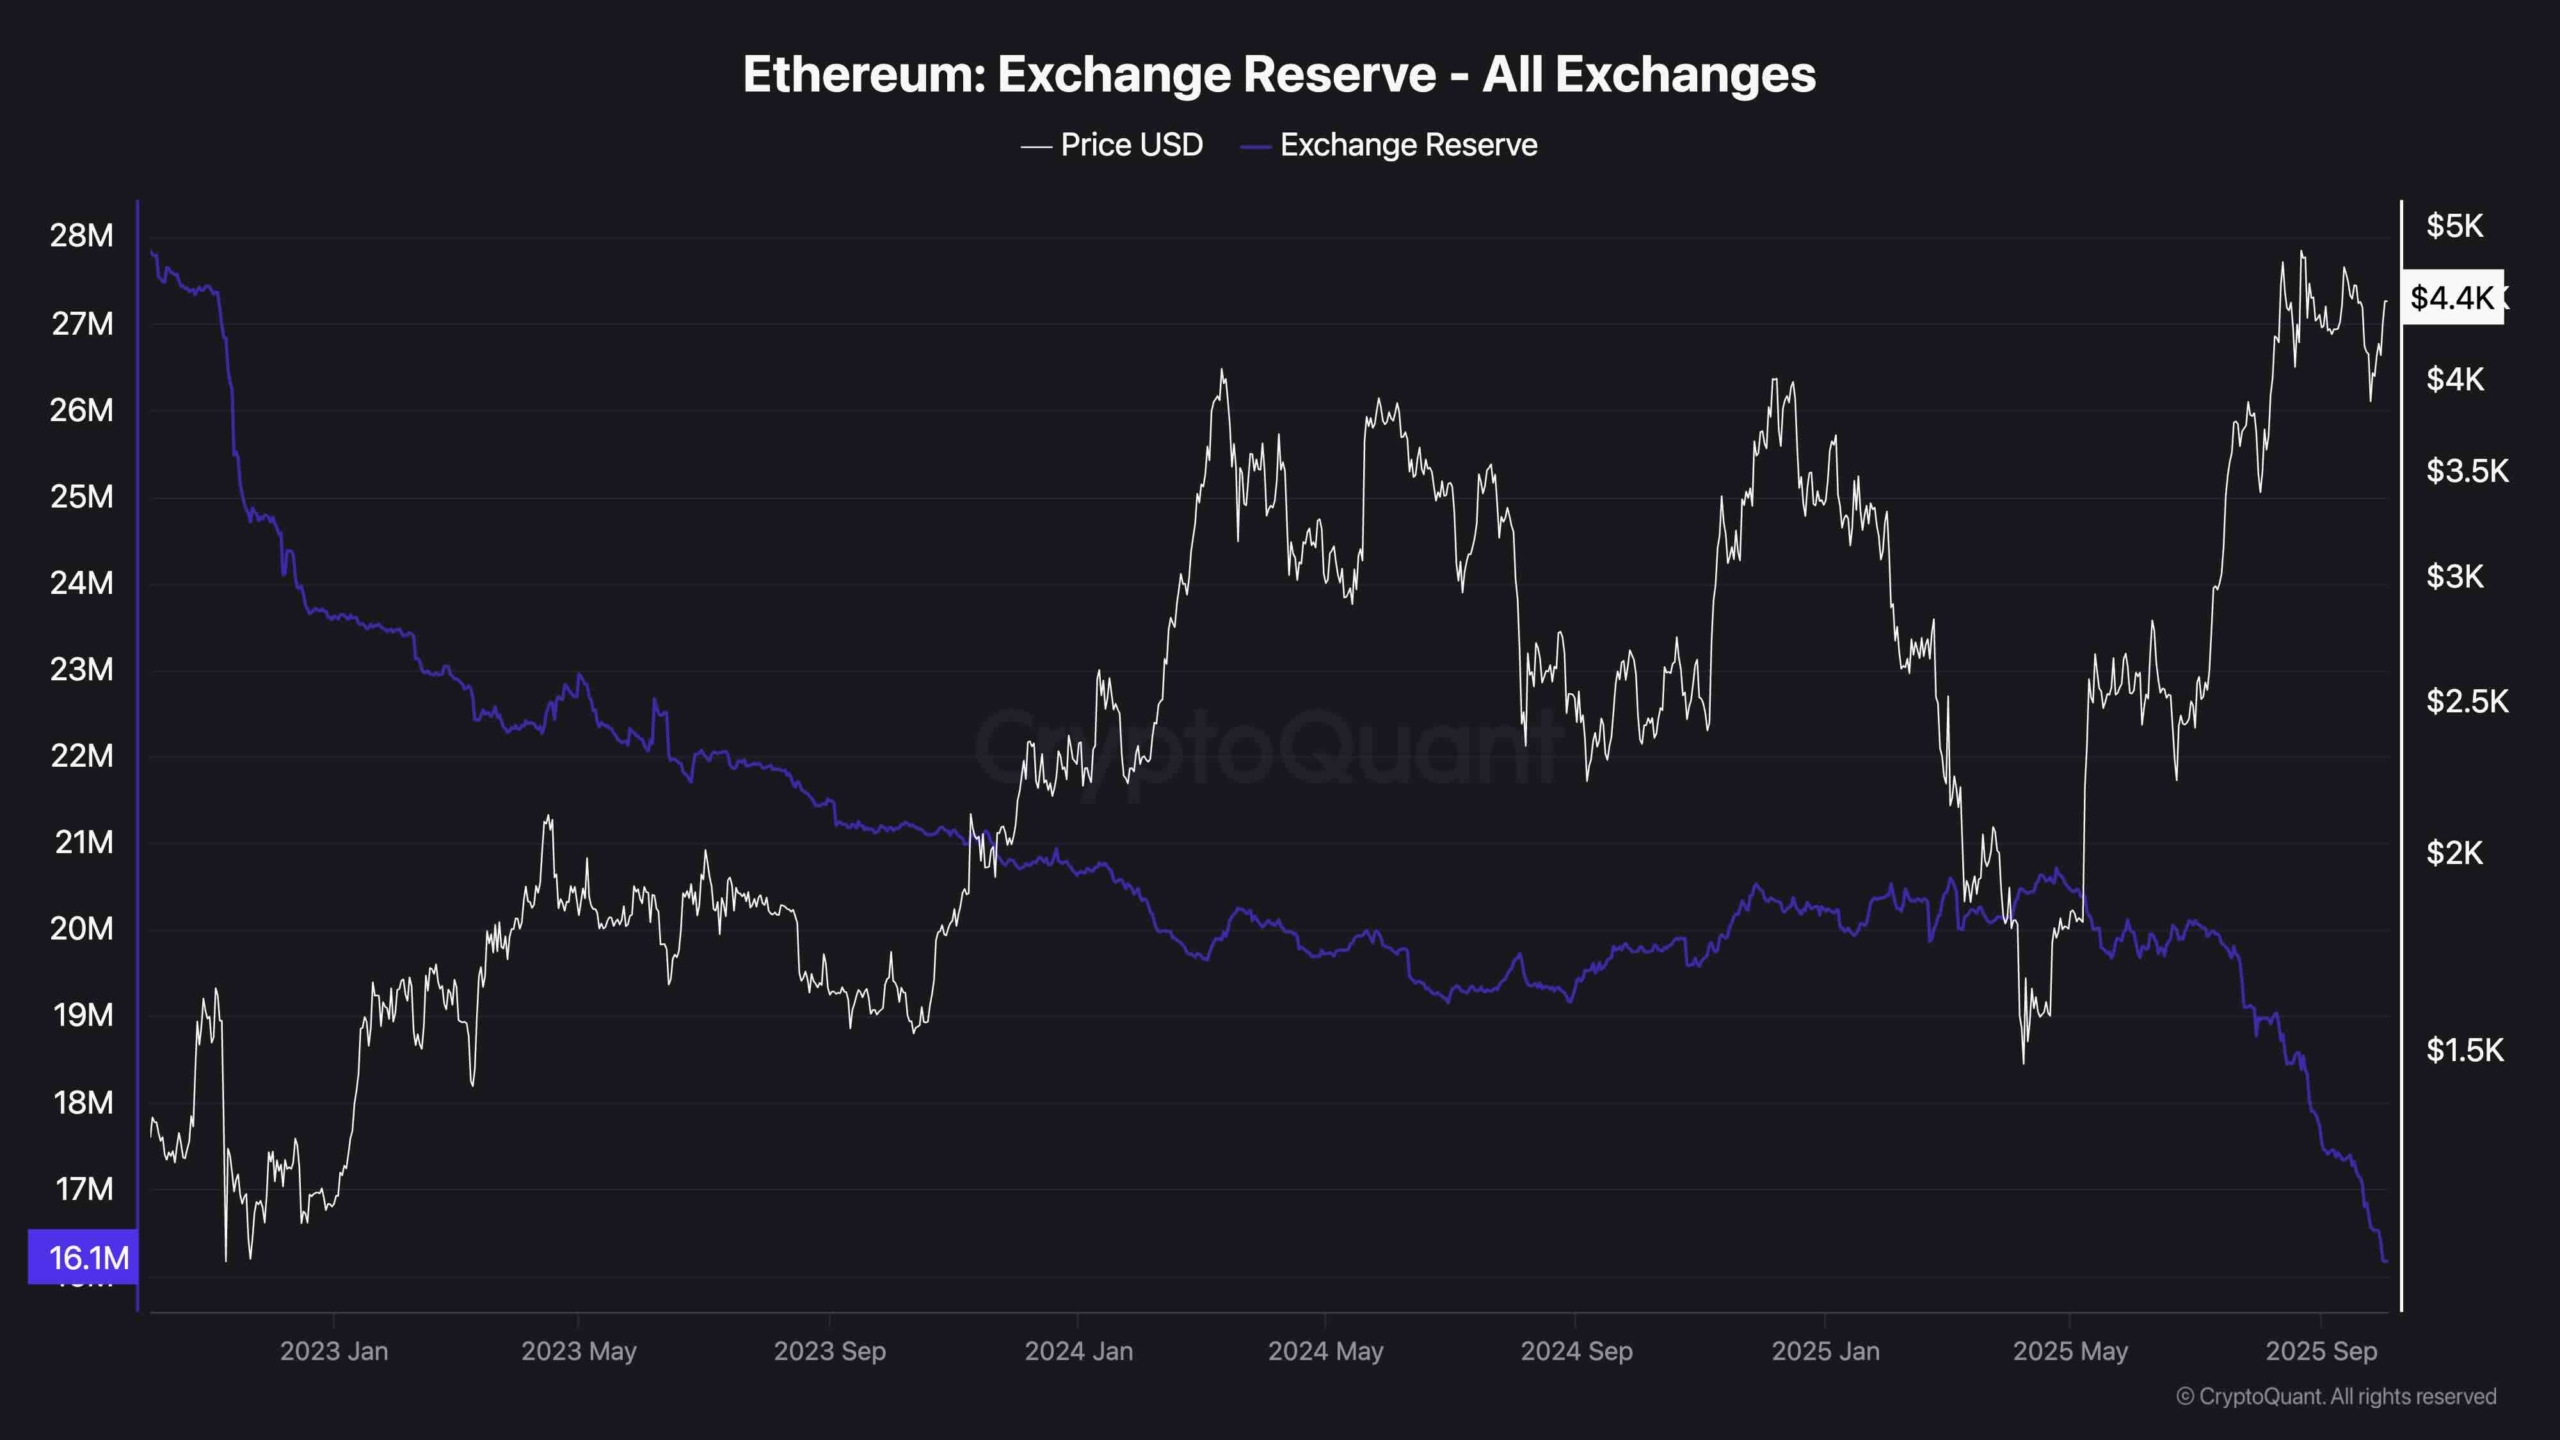
Exchange reserves for ETH have dropped to 16.1M, marking a steady multi-year decline. This indicates fewer coins are being held on exchanges, a bullish structural signal suggesting reduced selling pressure. Historically, such declines have coincided with major accumulation phases and rallies.
With supply on exchanges dropping at a significantly rapid pace and reaching its lowest in years, ETH’s medium-term outlook remains favorable, especially if demand continues to build around the $4K range. Of course, it is essential for the futures market not to go through a liquidation cascade that could overwhelm the spot market demand and lead to a price crash.
The post Ethereum Price Analysis: Can ETH Push Past Last Resistance Before $5K Target? appeared first on CryptoPotato.
—
Blog powered by G6
Disclaimer! A guest author has made this post. G6 has not checked the post. its content and attachments and under no circumstances will G6 be held responsible or liable in any way for any claims, damages, losses, expenses, costs or liabilities whatsoever (including, without limitation, any direct or indirect damages for loss of profits, business interruption or loss of information) resulting or arising directly or indirectly from your use of or inability to use this website or any websites linked to it, or from your reliance on the information and material on this website, even if the G6 has been advised of the possibility of such damages in advance.
For any inquiries, please contact [email protected]


