Ethereum continues to trade within a critical technical area after recovering sharply from its June lows. While the broader rebound remains intact, the latest price action suggests momentum is fading as buyers and sellers battle for control beneath major resistance.
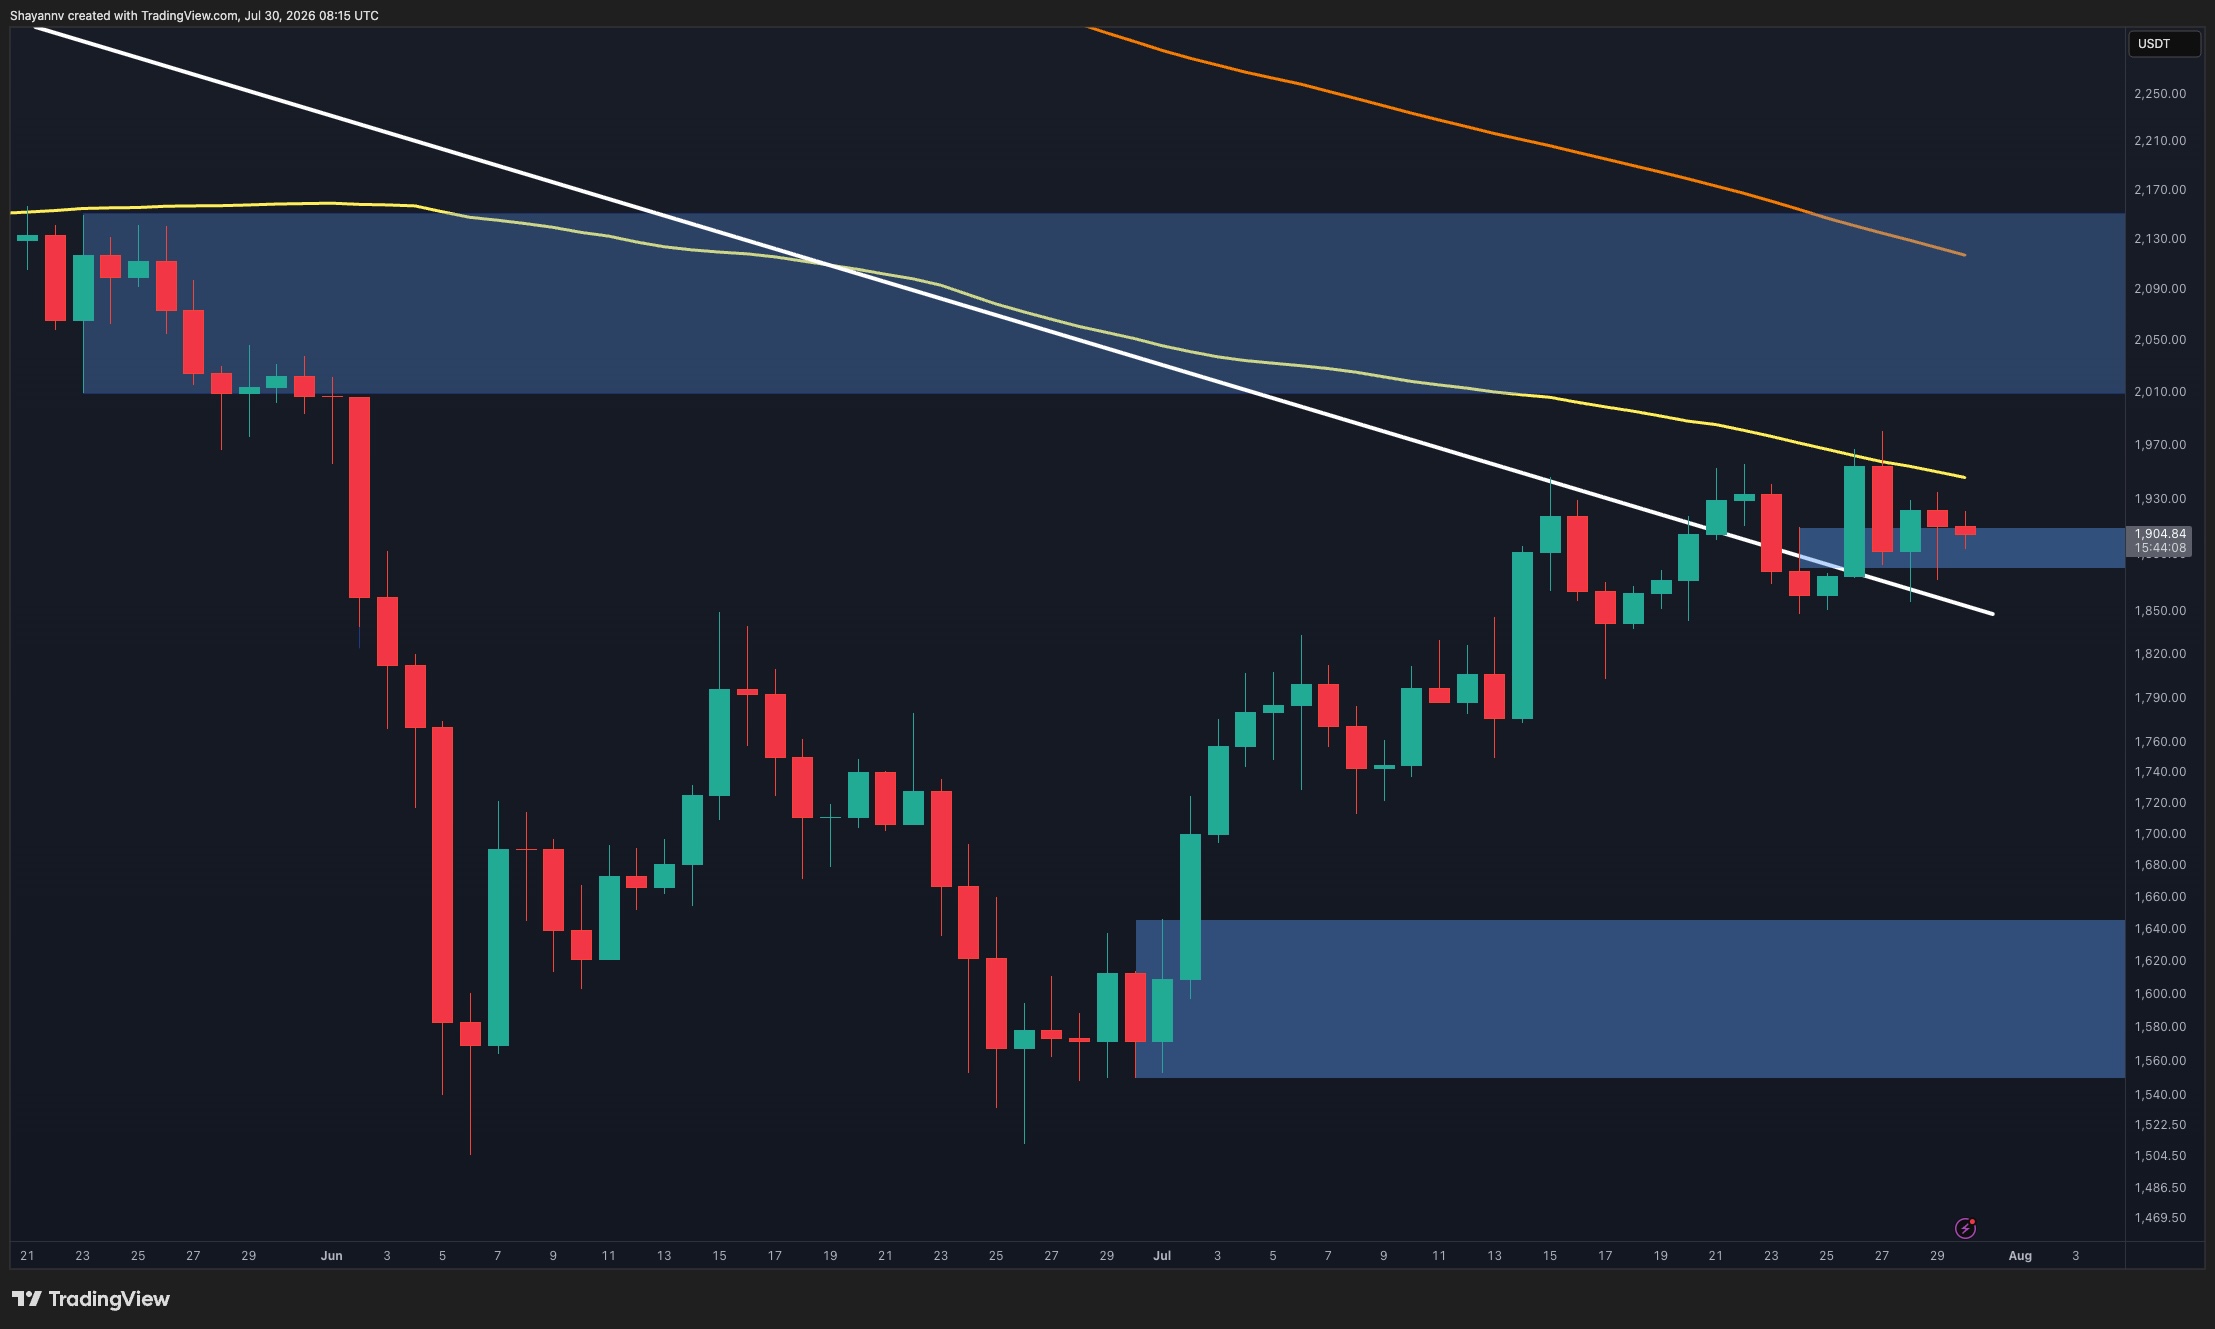
On the daily timeframe, Ethereum remains below both the 100-day and 200-day moving averages, keeping the broader trend cautious despite the recovery from the June bottom. The recent rally stalled just below the 100-day MA near the $1.95K region, where sellers quickly stepped in and pushed the price back toward the $1.88K to $1.91K supply zone.
This area is now acting as immediate resistance. A successful breakout above it would improve the medium-term outlook and expose the confluence of the 100-day and 200-day moving averages inside the $2.02K to $2.15K resistance zone. Until then, ETH remains vulnerable to another rejection.
On the downside, the $1.75K to $1.79K demand zone remains the first important support. Losing this area would likely trigger a deeper correction toward the major demand region around $1.56K to $1.64K.
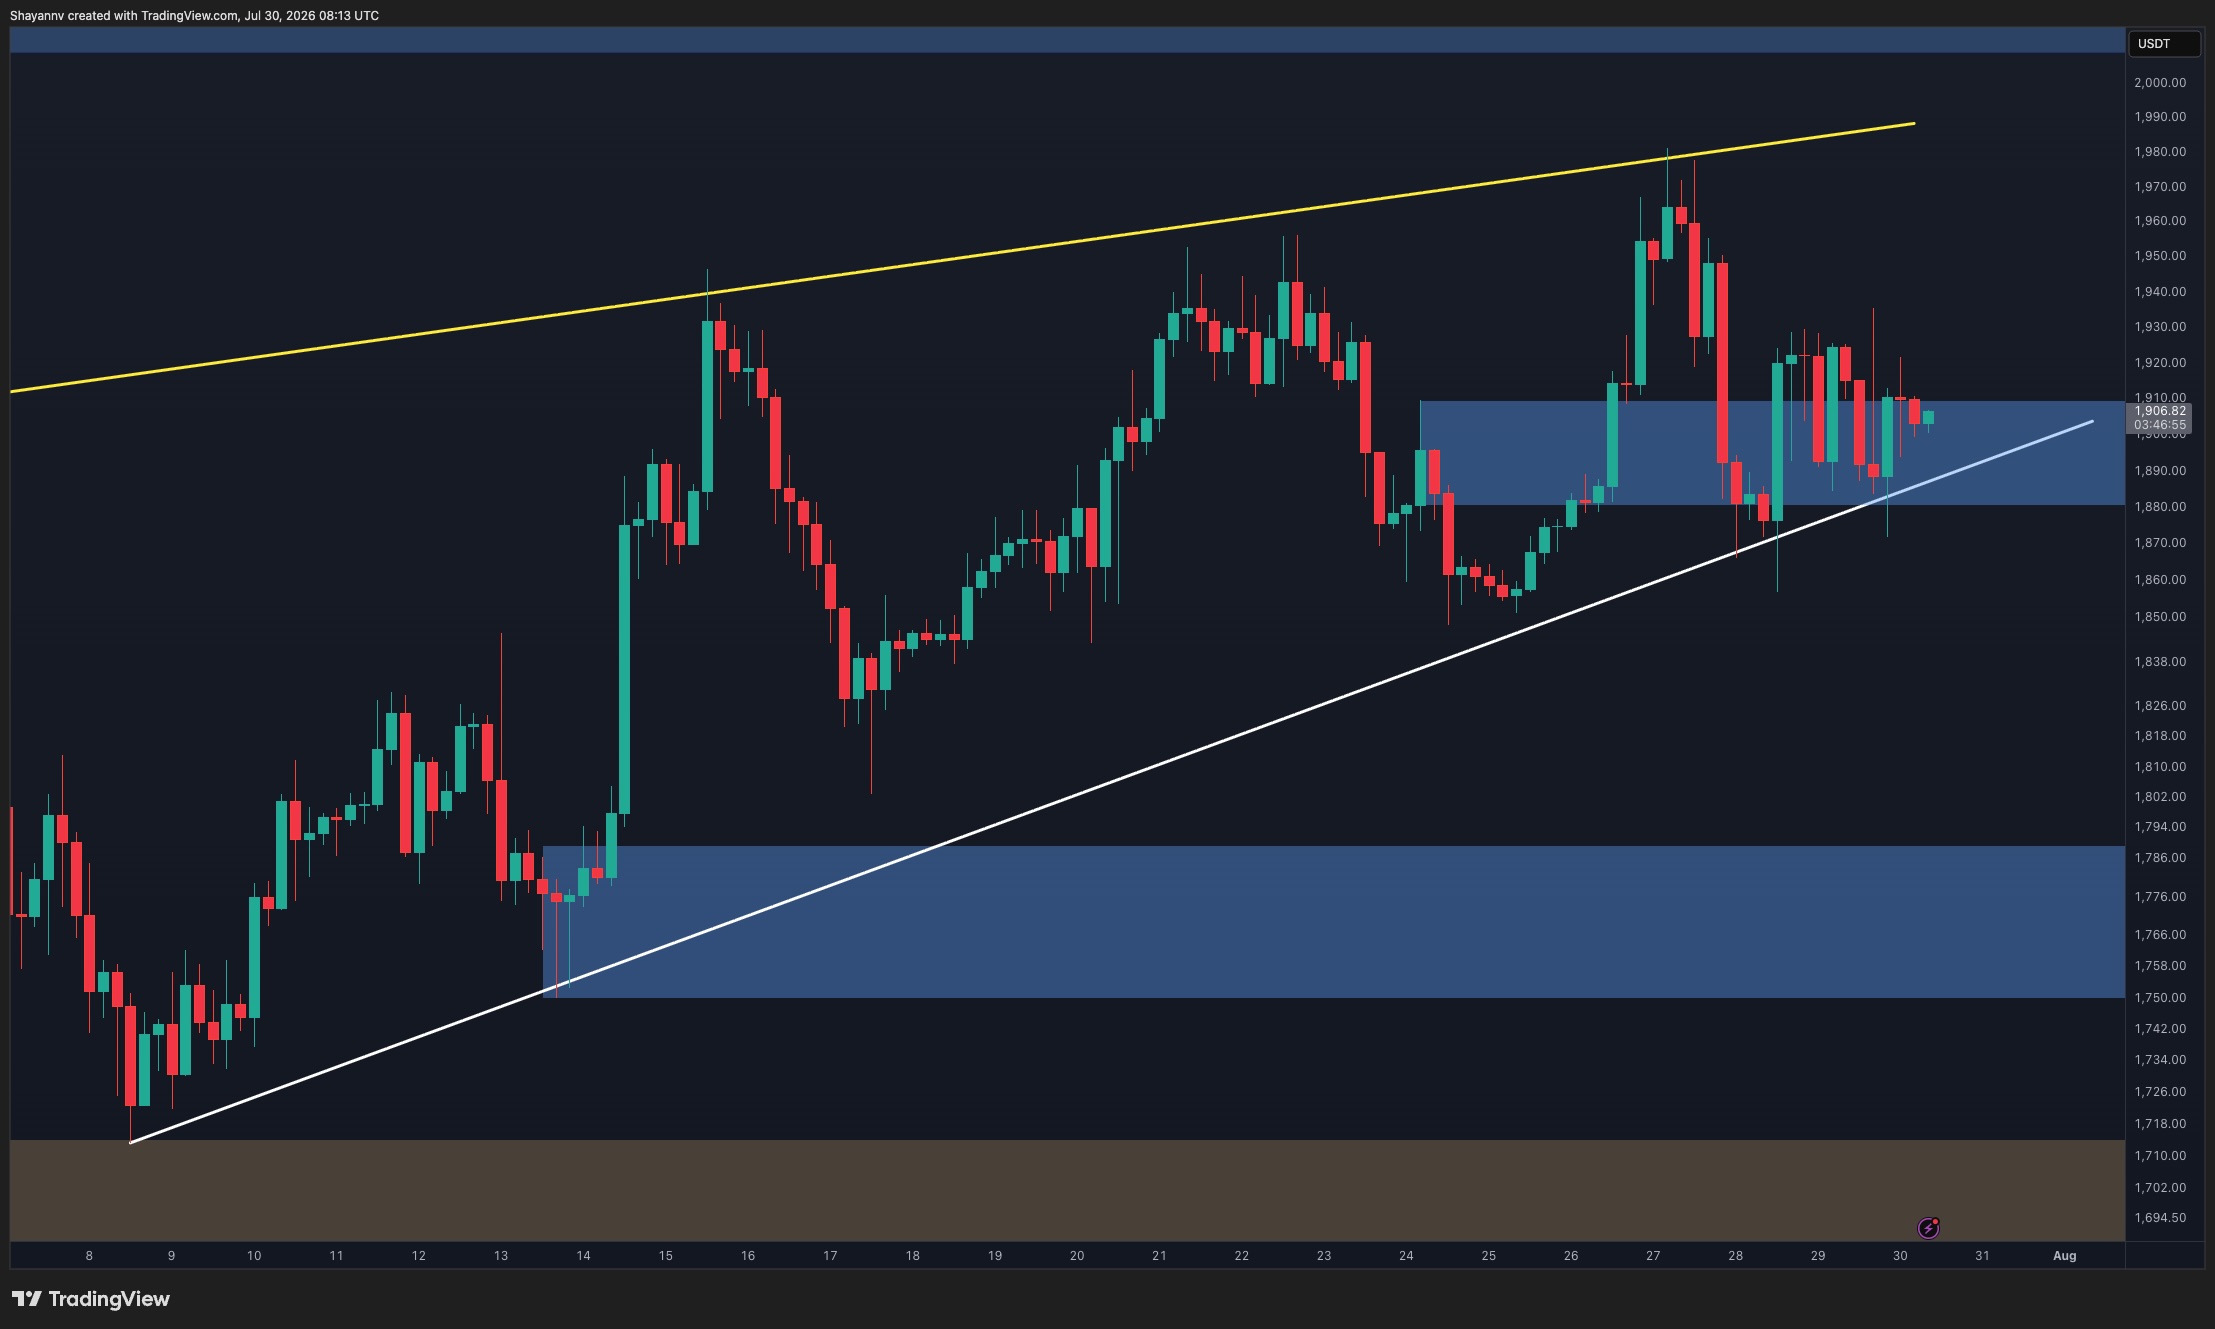
The 4-hour chart shows Ethereum trading inside a compression pattern, with price action confined between the rising white trendline and the descending yellow trendline. This narrowing range reflects increasing indecision as neither buyers nor sellers have been able to establish a decisive directional move.
Ethereum is currently consolidating around the $1.88K to $1.91K resistance zone while continuing to respect the ascending support trendline. A breakout above both the resistance zone and the descending trendline would likely strengthen bullish momentum and pave the way for another attempt at the recent highs.
However, a breakdown below the white ascending trendline would invalidate the current sequence of higher lows and could accelerate a correction toward the $1.75K to $1.79K demand zone, where buyers would be expected to defend the broader recovery structure.
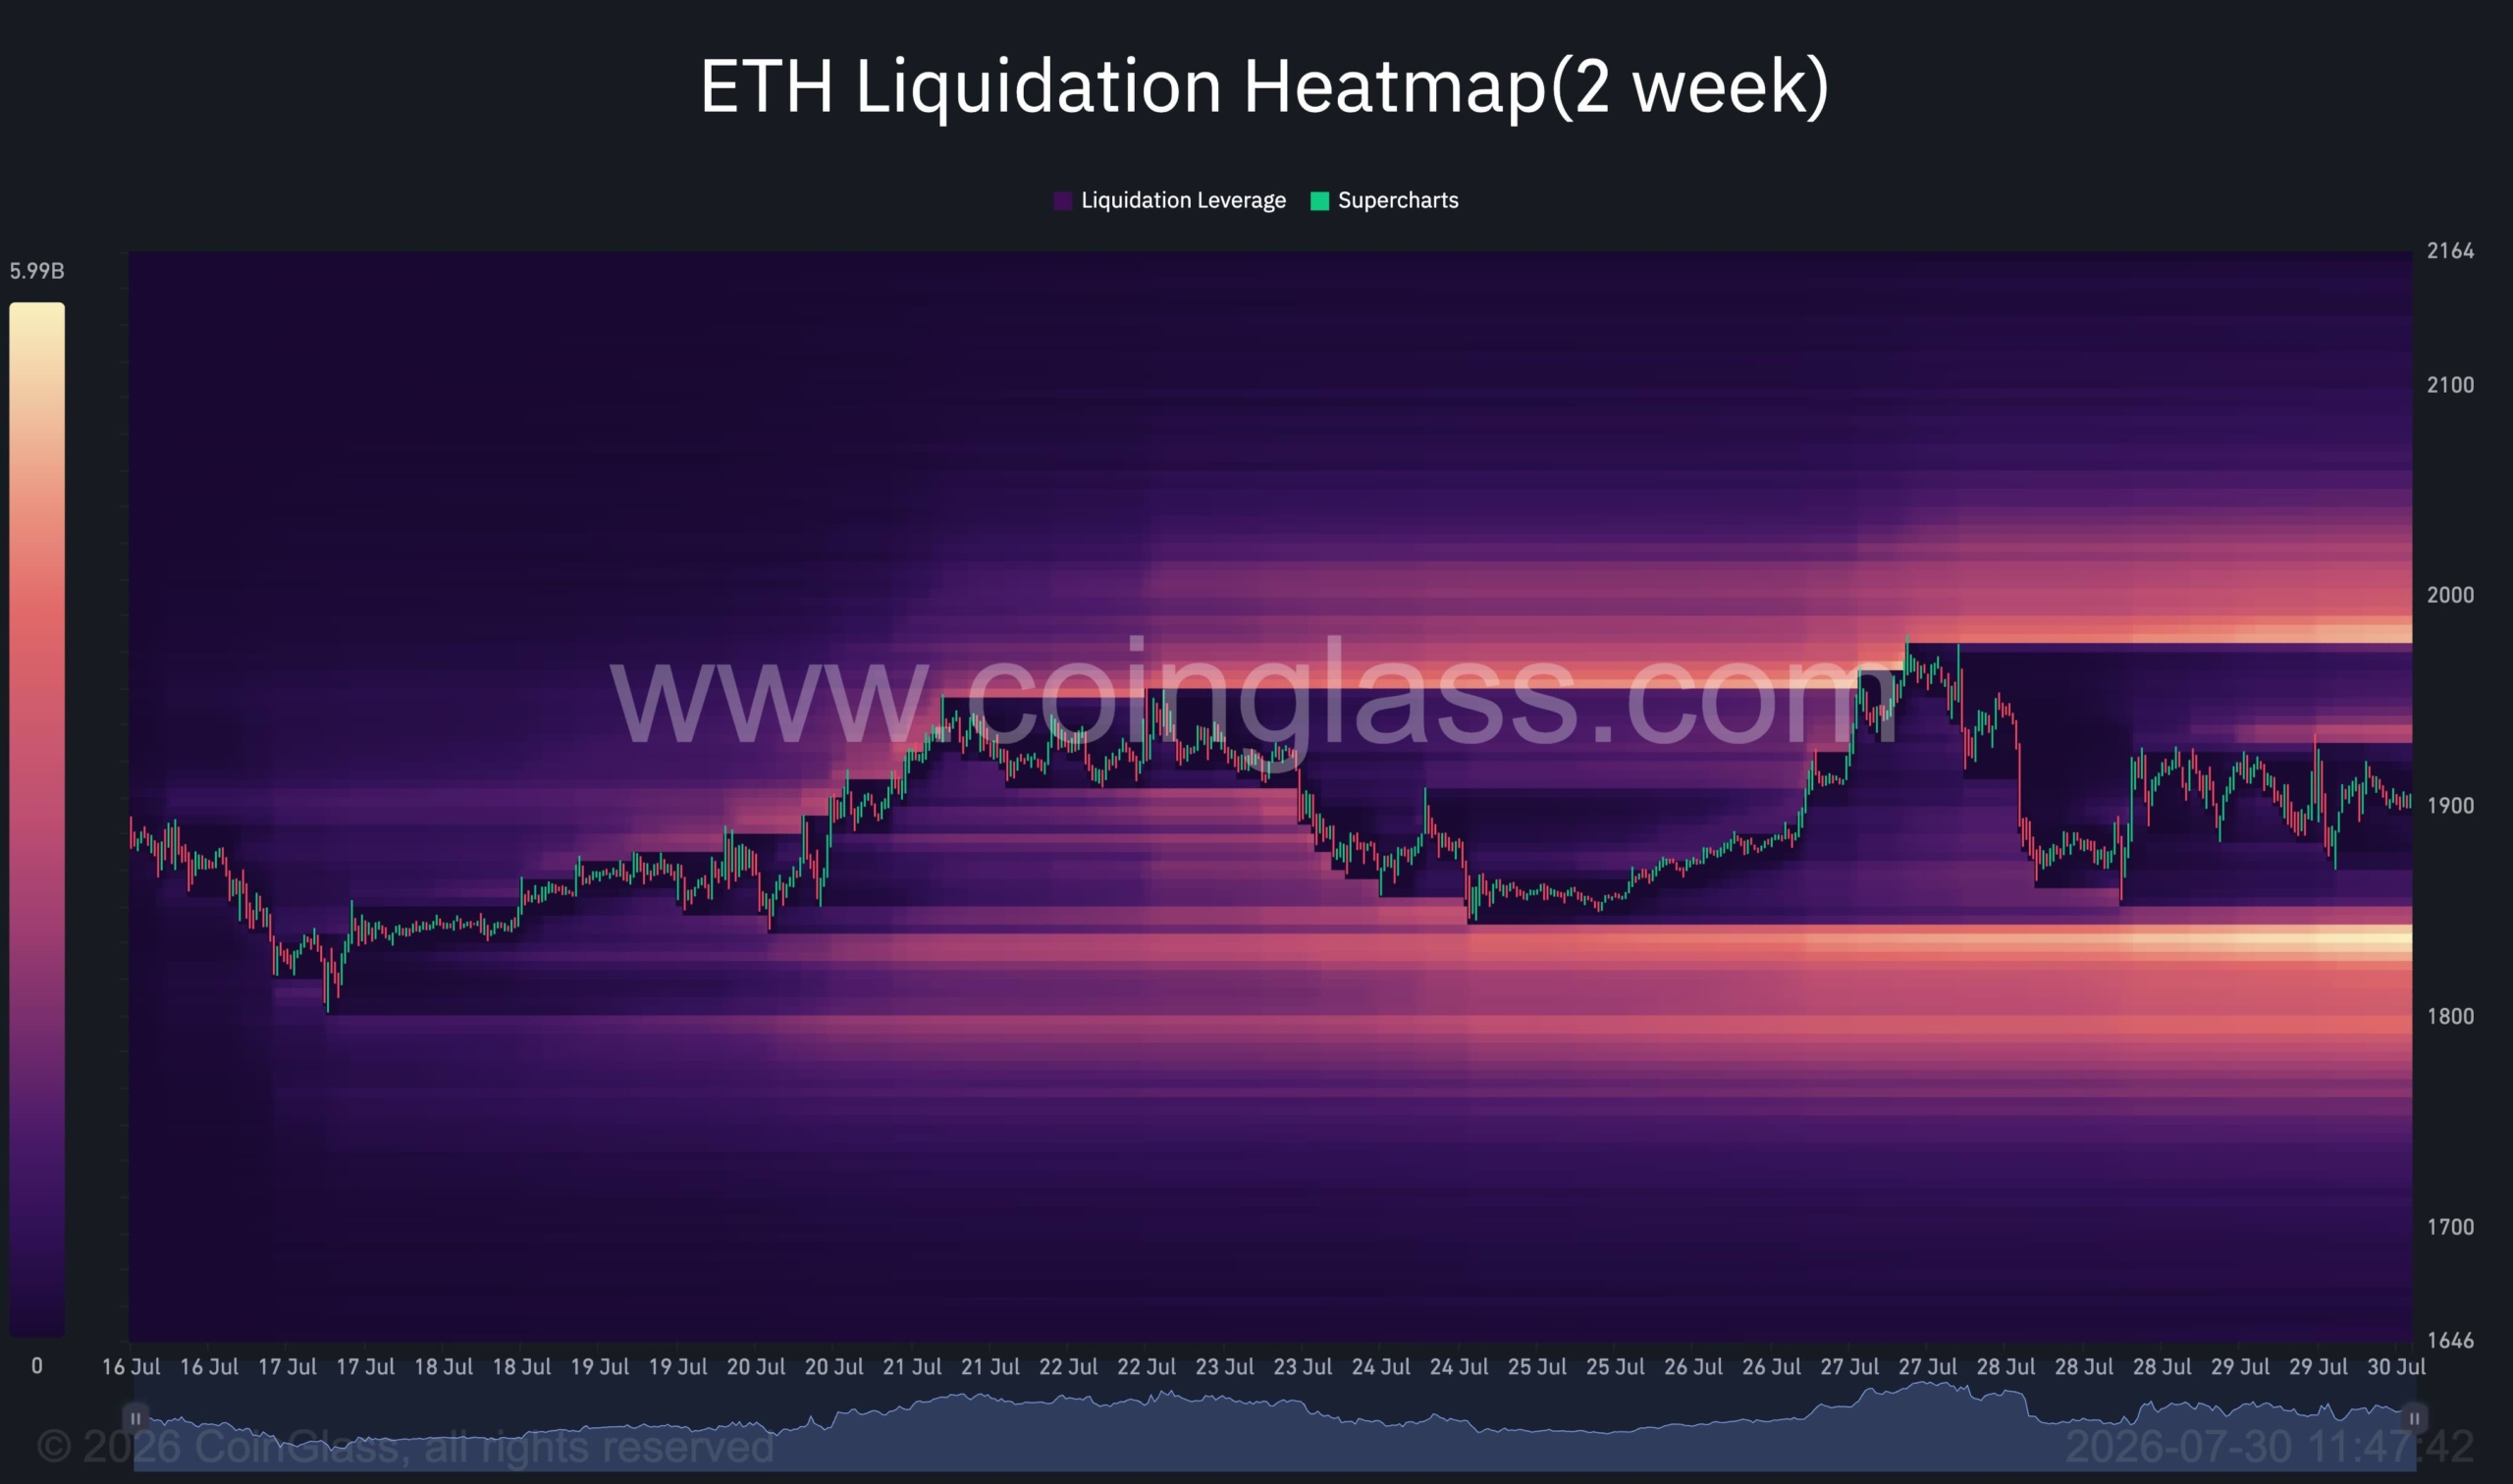
The two-week Binance liquidation heatmap highlights a notable concentration of liquidity above the current price around the $2K level, making it the primary upside liquidity target if buyers regain momentum.
At the same time, a significant liquidation cluster has formed around the $1.82K region beneath the market. Since price is currently trading between these two liquidity pools, Ethereum may continue to experience choppy and range-bound price action before making a decisive move toward one of these high-liquidity areas. A sweep of either cluster could trigger increased volatility as leveraged positions are liquidated.
The post Ethereum Price Analysis: ETH Holds Key Support but Bullish Momentum Fades appeared first on CryptoPotato.
—
Blog powered by G6
Disclaimer! A guest author has made this post. G6 has not checked the post. its content and attachments and under no circumstances will G6 be held responsible or liable in any way for any claims, damages, losses, expenses, costs or liabilities whatsoever (including, without limitation, any direct or indirect damages for loss of profits, business interruption or loss of information) resulting or arising directly or indirectly from your use of or inability to use this website or any websites linked to it, or from your reliance on the information and material on this website, even if the G6 has been advised of the possibility of such damages in advance.
For any inquiries, please contact [email protected]