Ethereum’s price action continues to reflect a market in equilibrium, where neither buyers nor sellers have established decisive control. Following the sharp corrective phase earlier in the year, ETH has transitioned into a broad consolidation structure, with volatility compressing as the market searches for direction.
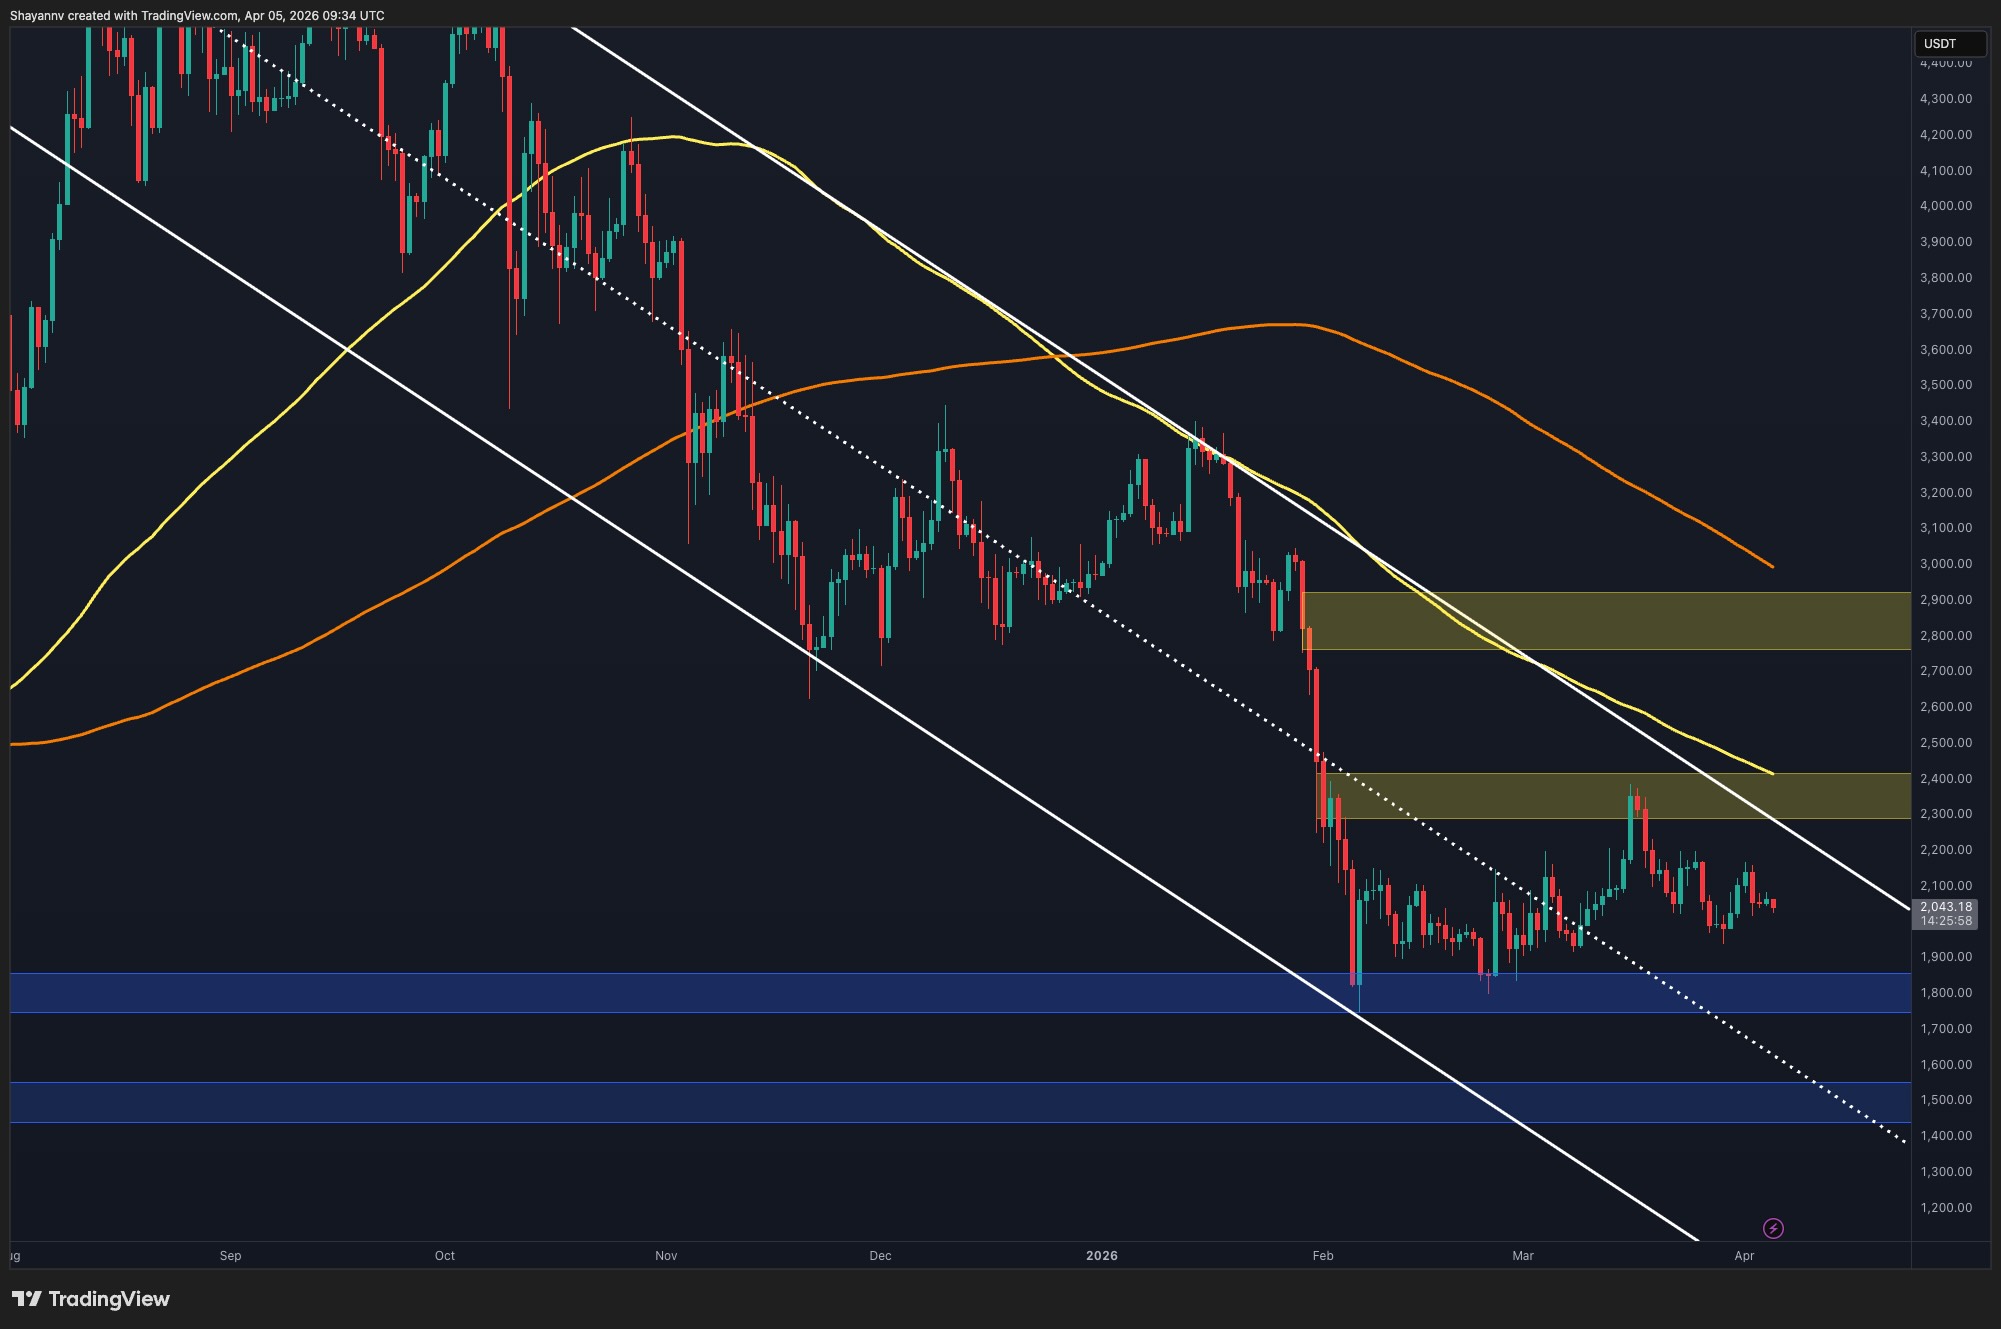
On the daily timeframe, Ethereum is clearly bounded within a well-defined range between the $1.8K support and the $2.4K resistance zone. The asset has repeatedly reacted to both boundaries, confirming them as key areas of supply and demand. The recent price action further reinforces this narrative, as Ethereum continues to oscillate within this range without any sustained breakout attempt.
This indicates a balance between accumulation and distribution, where market participants are positioning rather than committing to a directional move. As long as the price remains within this range, the broader outlook stays neutral, with range-trading conditions dominating the market structure.
A decisive breakout from either side of this range will likely define the next major trend. A confirmed move above $2.4K would signal strength and open the path toward higher resistance levels, while a breakdown below $1.8K would invalidate the current consolidation and expose the market to deeper downside continuation.
Zooming into the 4-hour timeframe, the structure reveals a rising wedge formation developing within the broader range. This pattern typically reflects weakening bullish momentum, as the price continues to make higher highs and higher lows, but with diminishing strength. The wedge suggests that the recent upward movements are corrective rather than impulsive, aligning with the broader consolidation observed on the daily chart.
As the price approaches the apex of this formation, a breakout becomes increasingly likely. A downside break of the wedge would confirm the corrective nature of the structure and could trigger another leg lower, potentially driving price back toward the $1.8K support zone. Until such a breakdown occurs, short-term fluctuations may persist within the wedge boundaries, but the risk of a deeper correction remains elevated.

From a liquidity standpoint, the liquidation heatmap highlights a significant concentration of liquidity at and below the $1.8K level. This cluster represents a pool of resting liquidity that could act as a magnet for the price, particularly if bearish momentum begins to build. Markets tend to gravitate toward such zones, as they provide fuel for volatility through forced liquidations.
In this context, a breakdown of the rising wedge on the lower timeframe could act as the trigger that drives Ethereum toward this liquidity pocket. If that scenario unfolds, the $1.8K region becomes not only a technical support level but also a key liquidity target where a reaction or potential reversal could emerge.
Overall, Ethereum remains trapped in a broader consolidation phase, but the lower timeframe structure suggests increasing vulnerability to the downside. The interaction between the rising wedge and the $1.8K liquidity cluster will likely play a critical role in shaping the next directional move.

The post Ethereum Price Analysis: Will ETH Break Out or Plunge to $1.8K Next? appeared first on CryptoPotato.
—
Blog powered by G6
Disclaimer! A guest author has made this post. G6 has not checked the post. its content and attachments and under no circumstances will G6 be held responsible or liable in any way for any claims, damages, losses, expenses, costs or liabilities whatsoever (including, without limitation, any direct or indirect damages for loss of profits, business interruption or loss of information) resulting or arising directly or indirectly from your use of or inability to use this website or any websites linked to it, or from your reliance on the information and material on this website, even if the G6 has been advised of the possibility of such damages in advance.
For any inquiries, please contact [email protected]


