Ethereum price started a recovery wave from the $2,820 zone. ETH is rising and now facing a major hurdle near the 100-hourly simple moving average.
Ethereum found support at $2,820 and started a recovery wave.
The price is trading below $3,050 and the 100-hourly Simple Moving Average.
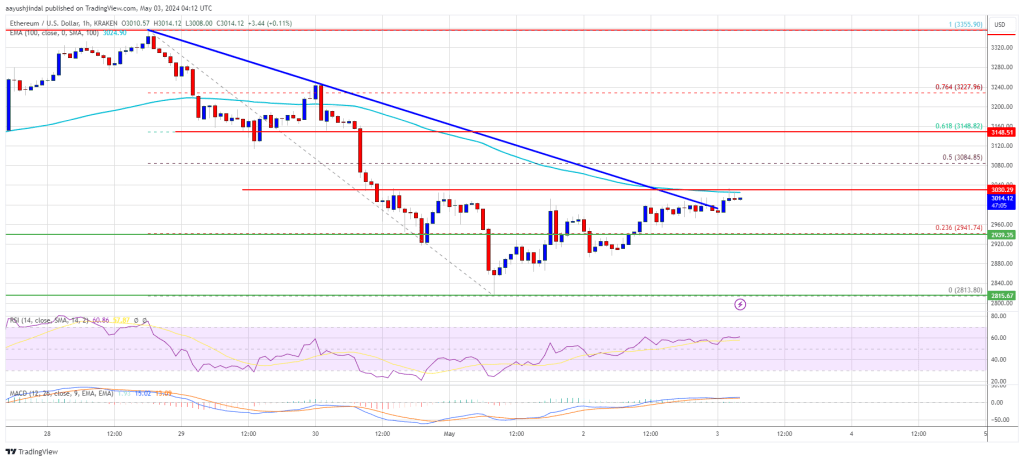
There was a break above a key bearish trend line with resistance at $3,000 on the hourly chart of ETH/USD (data feed via Kraken).
The pair could start a fresh decline if it fails to clear the $3,050 resistance.
Ethereum price extended losses below the $3,000 level, like Bitcoin. ETH even tested the $2,820 support zone. A low was formed at $2,813 and the price started a recovery wave.
There was a decent move above the $2,880 and $2,950 resistance levels. The price cleared the 23.6% Fib retracement level of the downward move from the $3,355 swing high to the $2,813 low. Besides, there was a break above a key bearish trend line with resistance at $3,000 on the hourly chart of ETH/USD.
However, the bears are active near the 100-hourly Simple Moving Average. Ethereum is now trading below $3,030 and the 100-hourly Simple Moving Average. Immediate resistance is near the $3,030 level. The first major resistance is near the $3,050 level.
The next key resistance sits at $3,085 or the 50% Fib retracement level of the downward move from the $3,355 swing high to the $2,813 low, above which the price might gain traction and rise toward the $3,150 level.
Source: ETHUSD on TradingView.com
If the bulls remain in action and push the price above $3,150, there could be a drift toward the $3,250 resistance. Any more gains could send Ether toward the $3,350 resistance zone.
If Ethereum fails to clear the $3,050 resistance, it could start another decline. Initial support on the downside is near the $2,940 level. The first major support is near the $2,880 zone.
The main support is near the $2,820 level. A clear move below the $2,820 support might push the price toward $2,740. Any more losses might send the price toward the $2,650 level in the near term.
Technical Indicators
Hourly MACD – The MACD for ETH/USD is losing momentum in the bearish zone.
Hourly RSI – The RSI for ETH/USD is now above the 50 level.
Major Support Level – $2,940
Major Resistance Level – $3,050
—
Blog powered by G6
Disclaimer! A guest author has made this post. G6 has not checked the post. its content and attachments and under no circumstances will G6 be held responsible or liable in any way for any claims, damages, losses, expenses, costs or liabilities whatsoever (including, without limitation, any direct or indirect damages for loss of profits, business interruption or loss of information) resulting or arising directly or indirectly from your use of or inability to use this website or any websites linked to it, or from your reliance on the information and material on this website, even if the G6 has been advised of the possibility of such damages in advance.
For any inquiries, please contact [email protected]


