Pepe (PEPE) is gaining traction among traders, as chart patterns and blockchain activity suggest a potential move higher. The token traded at around $0.00001 at press time, with a 24-hour volume of over $608 million.
While the daily change is slightly negative, the token is up 8% over the last seven days. Analysts are now focusing on the $0.0000125 level as the next possible area of interest.
According to Bitcoinsensus, a Power of 3 (PO3) setup is forming on the PEPE/USDT chart. This type of setup includes a period of sideways movement, a temporary drop below support, and then a breakout above the range. The recent dip and recovery seen in late September fit this model.
#Pepe Power of 3 Setup in Play
$PEPE could be targeting the 0.0000125$ zone next.
Range, bear trap
, mark up
pic.twitter.com/3L3ZBQgKx3
— Bitcoinsensus (@Bitcoinsensus) October 3, 2025
Interestingly, the chart shows the price moving from a false breakdown, known as a bear trap, into a new upward phase. With PEPE breaking above the $0.00001000 mark, the setup suggests momentum is shifting. If this continues, the $0.00001250 zone is the next area being watched by traders.
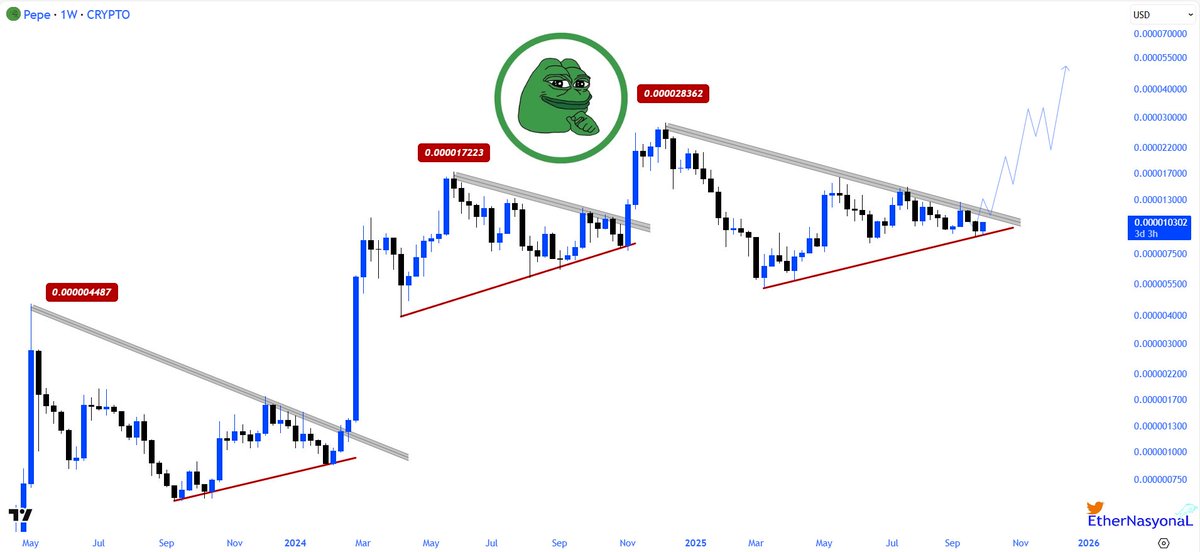
A weekly chart posted by EtherNasyonaL shows PEPE forming another triangle pattern, similar to past setups that led to sharp price increases. These past moves started from lower levels such as $0.00000045, followed by breakouts near $0.00001722 and $0.00002836.
Notably, the current formation also includes a tightening triangle, with the price now close to the upper trendline. If this pattern holds, a breakout could follow the same direction as earlier moves. The post referred to the setup as “The sleeping giant $PEPE will soon awaken,” suggesting the current consolidation phase could be nearing its end.
In addition, blockchain data from Nansen shows that total token balances held by smaller holders have declined from around 259 trillion to 253 trillion over the past month. In contrast, the top 100 addresses have raised their holdings by 4%, now controlling 307 trillion tokens.
Currently, 60.21% of the supply is held across all wallets, with a distribution score of 20. This shift suggests tokens are moving from smaller wallets to larger ones, often interpreted as accumulation during periods of lower activity.
The short-term chart shows PEPE recently pulling back after a sharp move up. Bollinger Bands are widening, indicating more price movements ahead. The token has dropped from the upper band and is now near the middle band, which sits around $0.0000097.
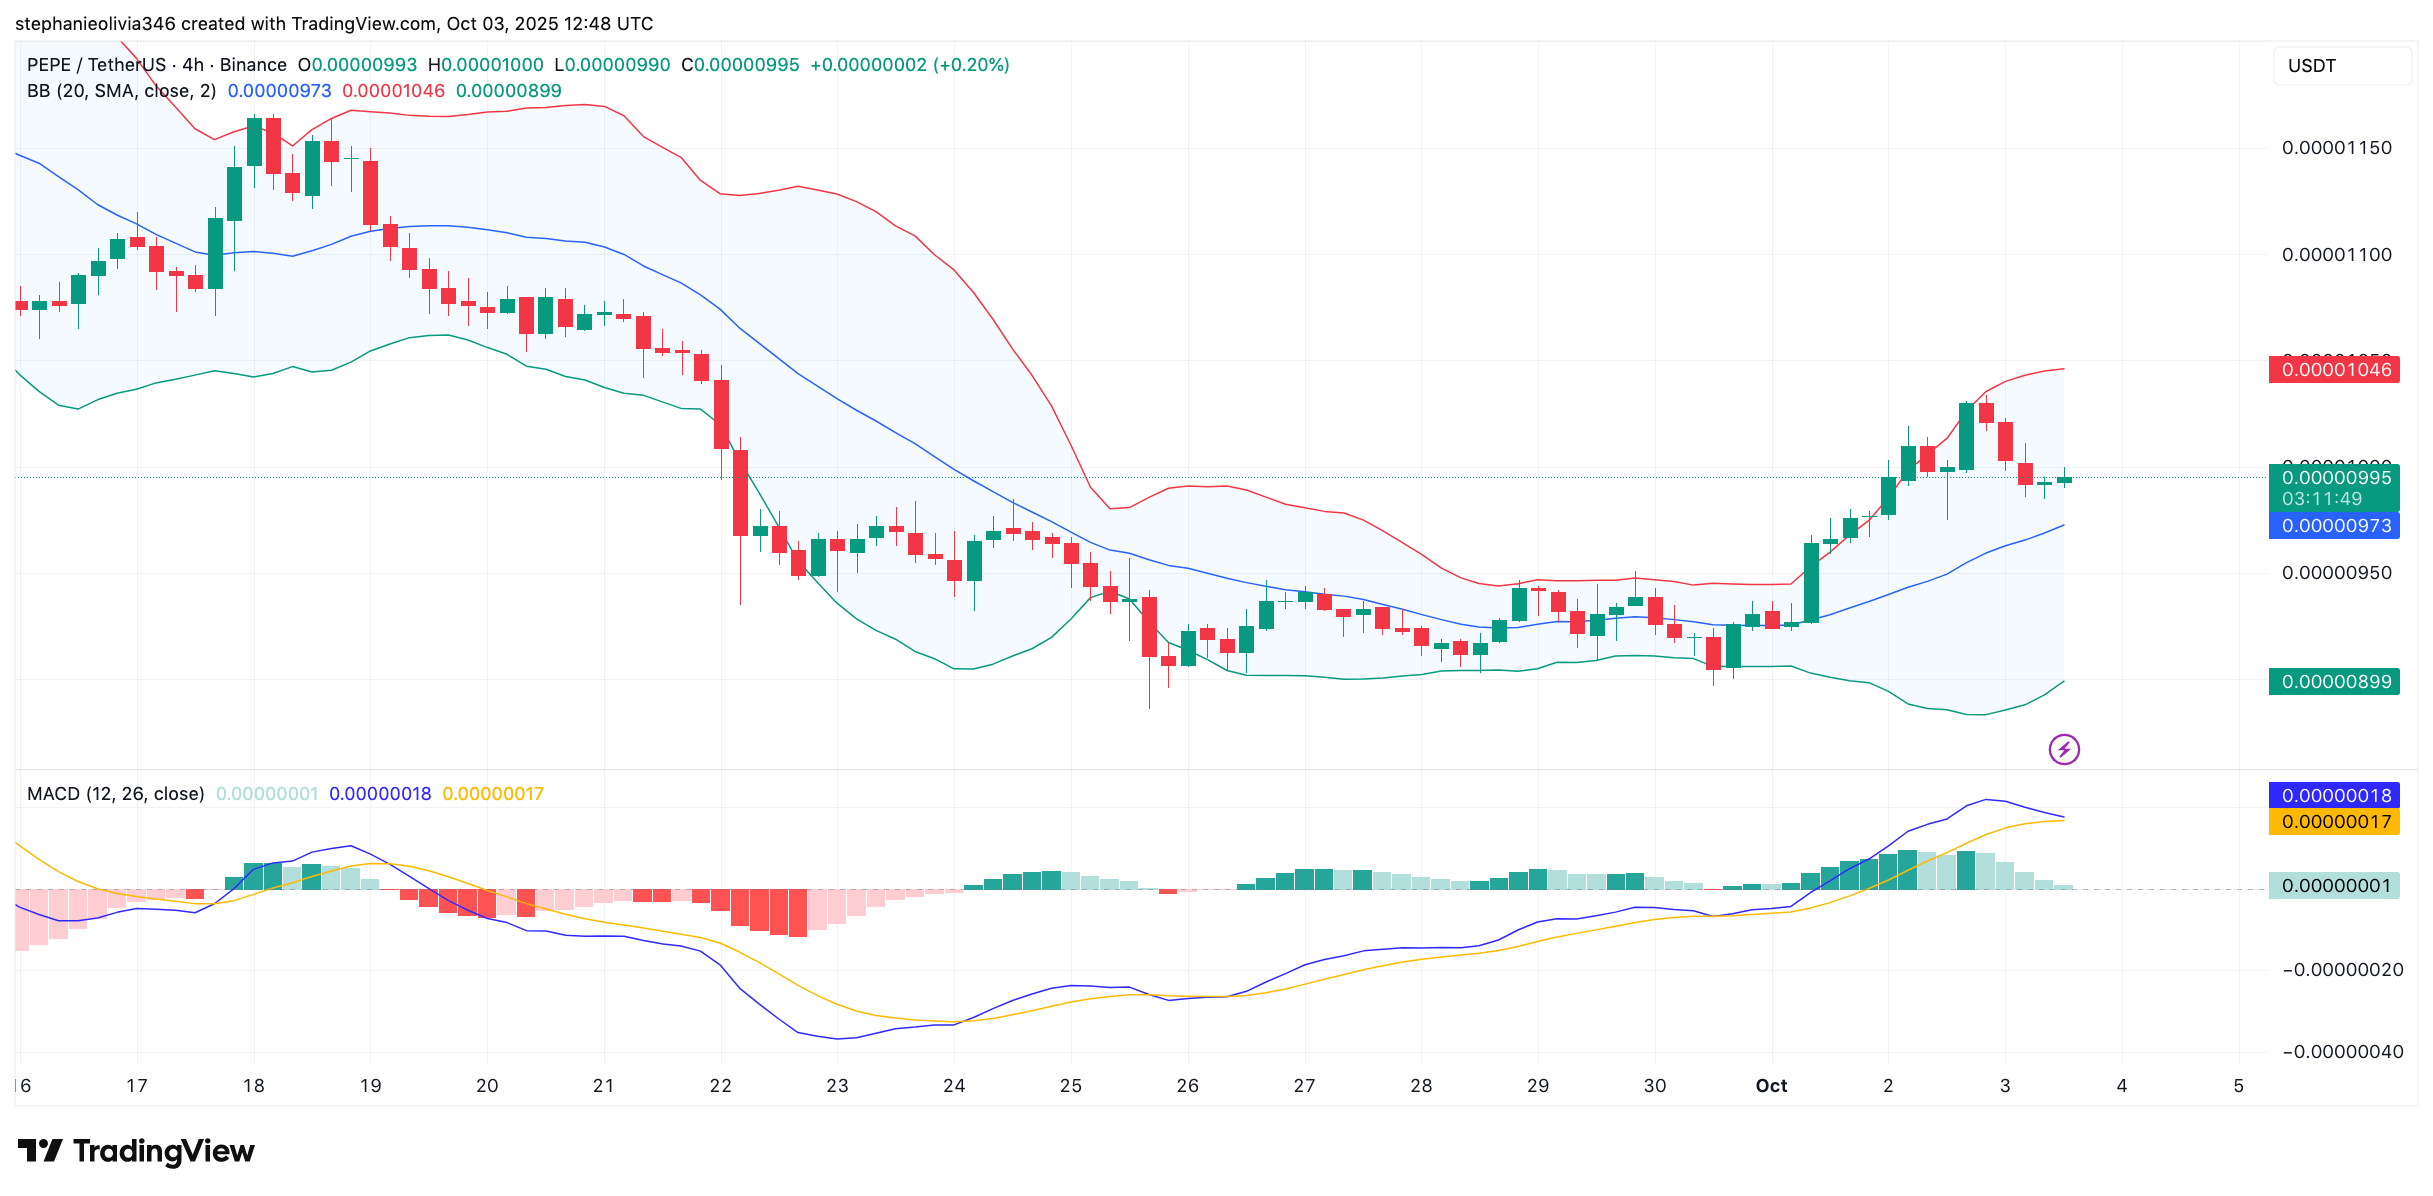
In bullish territory is where the MACD lies. It still remains above the signal line, and the bars of the MACD histogram are shrinking. This indicates that the momentum of the rise is waning; nevertheless, the trend stays in power unless support is blown away.
The post Is PEPE Waking Up? Chart Patterns Point to Big Move Ahead appeared first on CryptoPotato.
—
Blog powered by G6
Disclaimer! A guest author has made this post. G6 has not checked the post. its content and attachments and under no circumstances will G6 be held responsible or liable in any way for any claims, damages, losses, expenses, costs or liabilities whatsoever (including, without limitation, any direct or indirect damages for loss of profits, business interruption or loss of information) resulting or arising directly or indirectly from your use of or inability to use this website or any websites linked to it, or from your reliance on the information and material on this website, even if the G6 has been advised of the possibility of such damages in advance.
For any inquiries, please contact [email protected]