Dogecoin’s daily chart is coiling into a technically clean inflection, according to trader IncomeSharks, who posted a rising channel and an on-balance volume (OBV) wedge that together map a straightforward route to higher levels. “DOGE – Not a bad setup. Obvious channel and clear OBV wedge. Ideally OBV will break out before price,” the analyst wrote, sharing the chart that frames the current advance.
Price has been respecting a well-defined ascending channel that has governed trade since early summer. Multiple touches on both boundaries validate the structure: higher lows along the lower trendline from July through early October, and lower-high rejections against the upper rail through mid-July, late August, and late September.
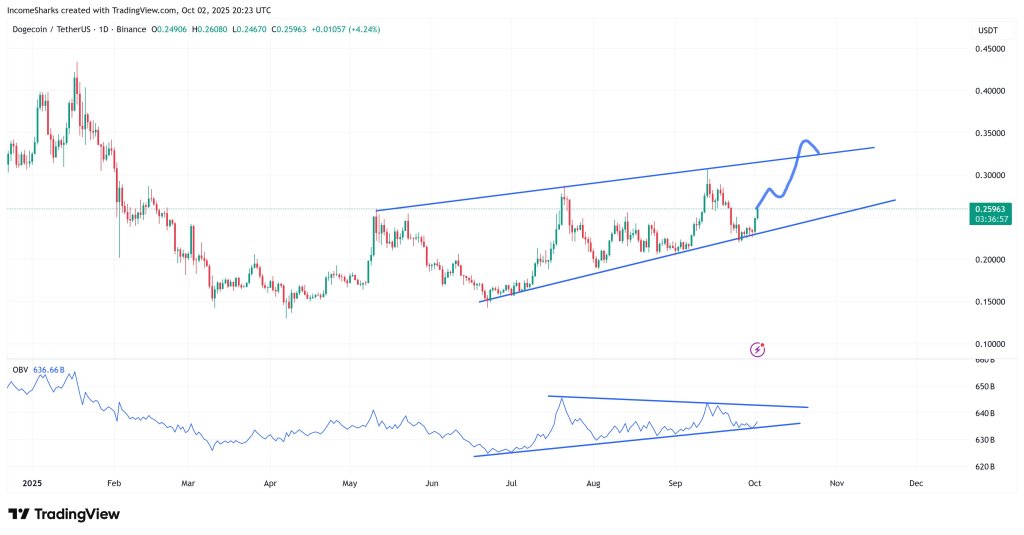
After a fresh rebound off the rising support area at the start of October, DOGE has pushed back into the channel’s mid-range, where it typically pauses before the next impulse. IncomeSharks’ path sketch envisions a brief consolidation or shallow pullback inside the channel, followed by a drive toward the ceiling.
The destination is explicit on the chart. The upper boundary currently intersects in the low-to-mid $0.30s, and the drawing marks a breakout attempt between roughly $0.32 and $0.33. That zone represents confluence: it’s where the rising channel’s resistance comes into play and where late-September supply capped the prior thrust. A decisive daily close through that band would confirm a bullish channel breakout and leave the door open for a run towards the early December 2024 high at $0.4843.
Volume dynamics are the tell to watch. The lower panel plots OBV, a cumulative measure of buy/sell pressure, compressed into a symmetrical wedge: a gently rising base since mid-July and a descending lid drawn off the July and September OBV peaks. This kind of narrowing range in OBV often precedes a directional expansion.
IncomeSharks’ comment underscores that sequencing: an OBV breakout ahead of price would signal fresh accumulation and improve the odds that price follows with a push to the channel’s top. Conversely, failure of OBV at its wedge support would warn that the rebound lacks sponsorship, increasing the risk of another test of the lower channel line.
Structurally, the setup is straightforward. As long as DOGE continues to hold the rising support that has defined the trend since July, the path of least resistance remains up within the channel. A clean OBV break of its wedge would strengthen that view.
If bulls can then clear overhead supply and convert the $0.32–$0.33 band into support, the chart would confirm the breakout roadmap IncomeSharks outlined. If instead price loses the ascending base, the channel thesis would be invalidated and the market would likely revisit prior higher-low areas along the lower rail before attempting another trend leg.
At press time, DOGE traded at $0.2559.
—
Blog powered by G6
Disclaimer! A guest author has made this post. G6 has not checked the post. its content and attachments and under no circumstances will G6 be held responsible or liable in any way for any claims, damages, losses, expenses, costs or liabilities whatsoever (including, without limitation, any direct or indirect damages for loss of profits, business interruption or loss of information) resulting or arising directly or indirectly from your use of or inability to use this website or any websites linked to it, or from your reliance on the information and material on this website, even if the G6 has been advised of the possibility of such damages in advance.
For any inquiries, please contact [email protected]


