Polkadot’s recent price movement has seen it finding support from the crucial 200-day moving average, prompting a bullish retracement. However, despite this upward trajectory, the cryptocurrency faces several critical resistance levels ahead, casting doubt on the sustainability of the bullish retracement.
By Shayan
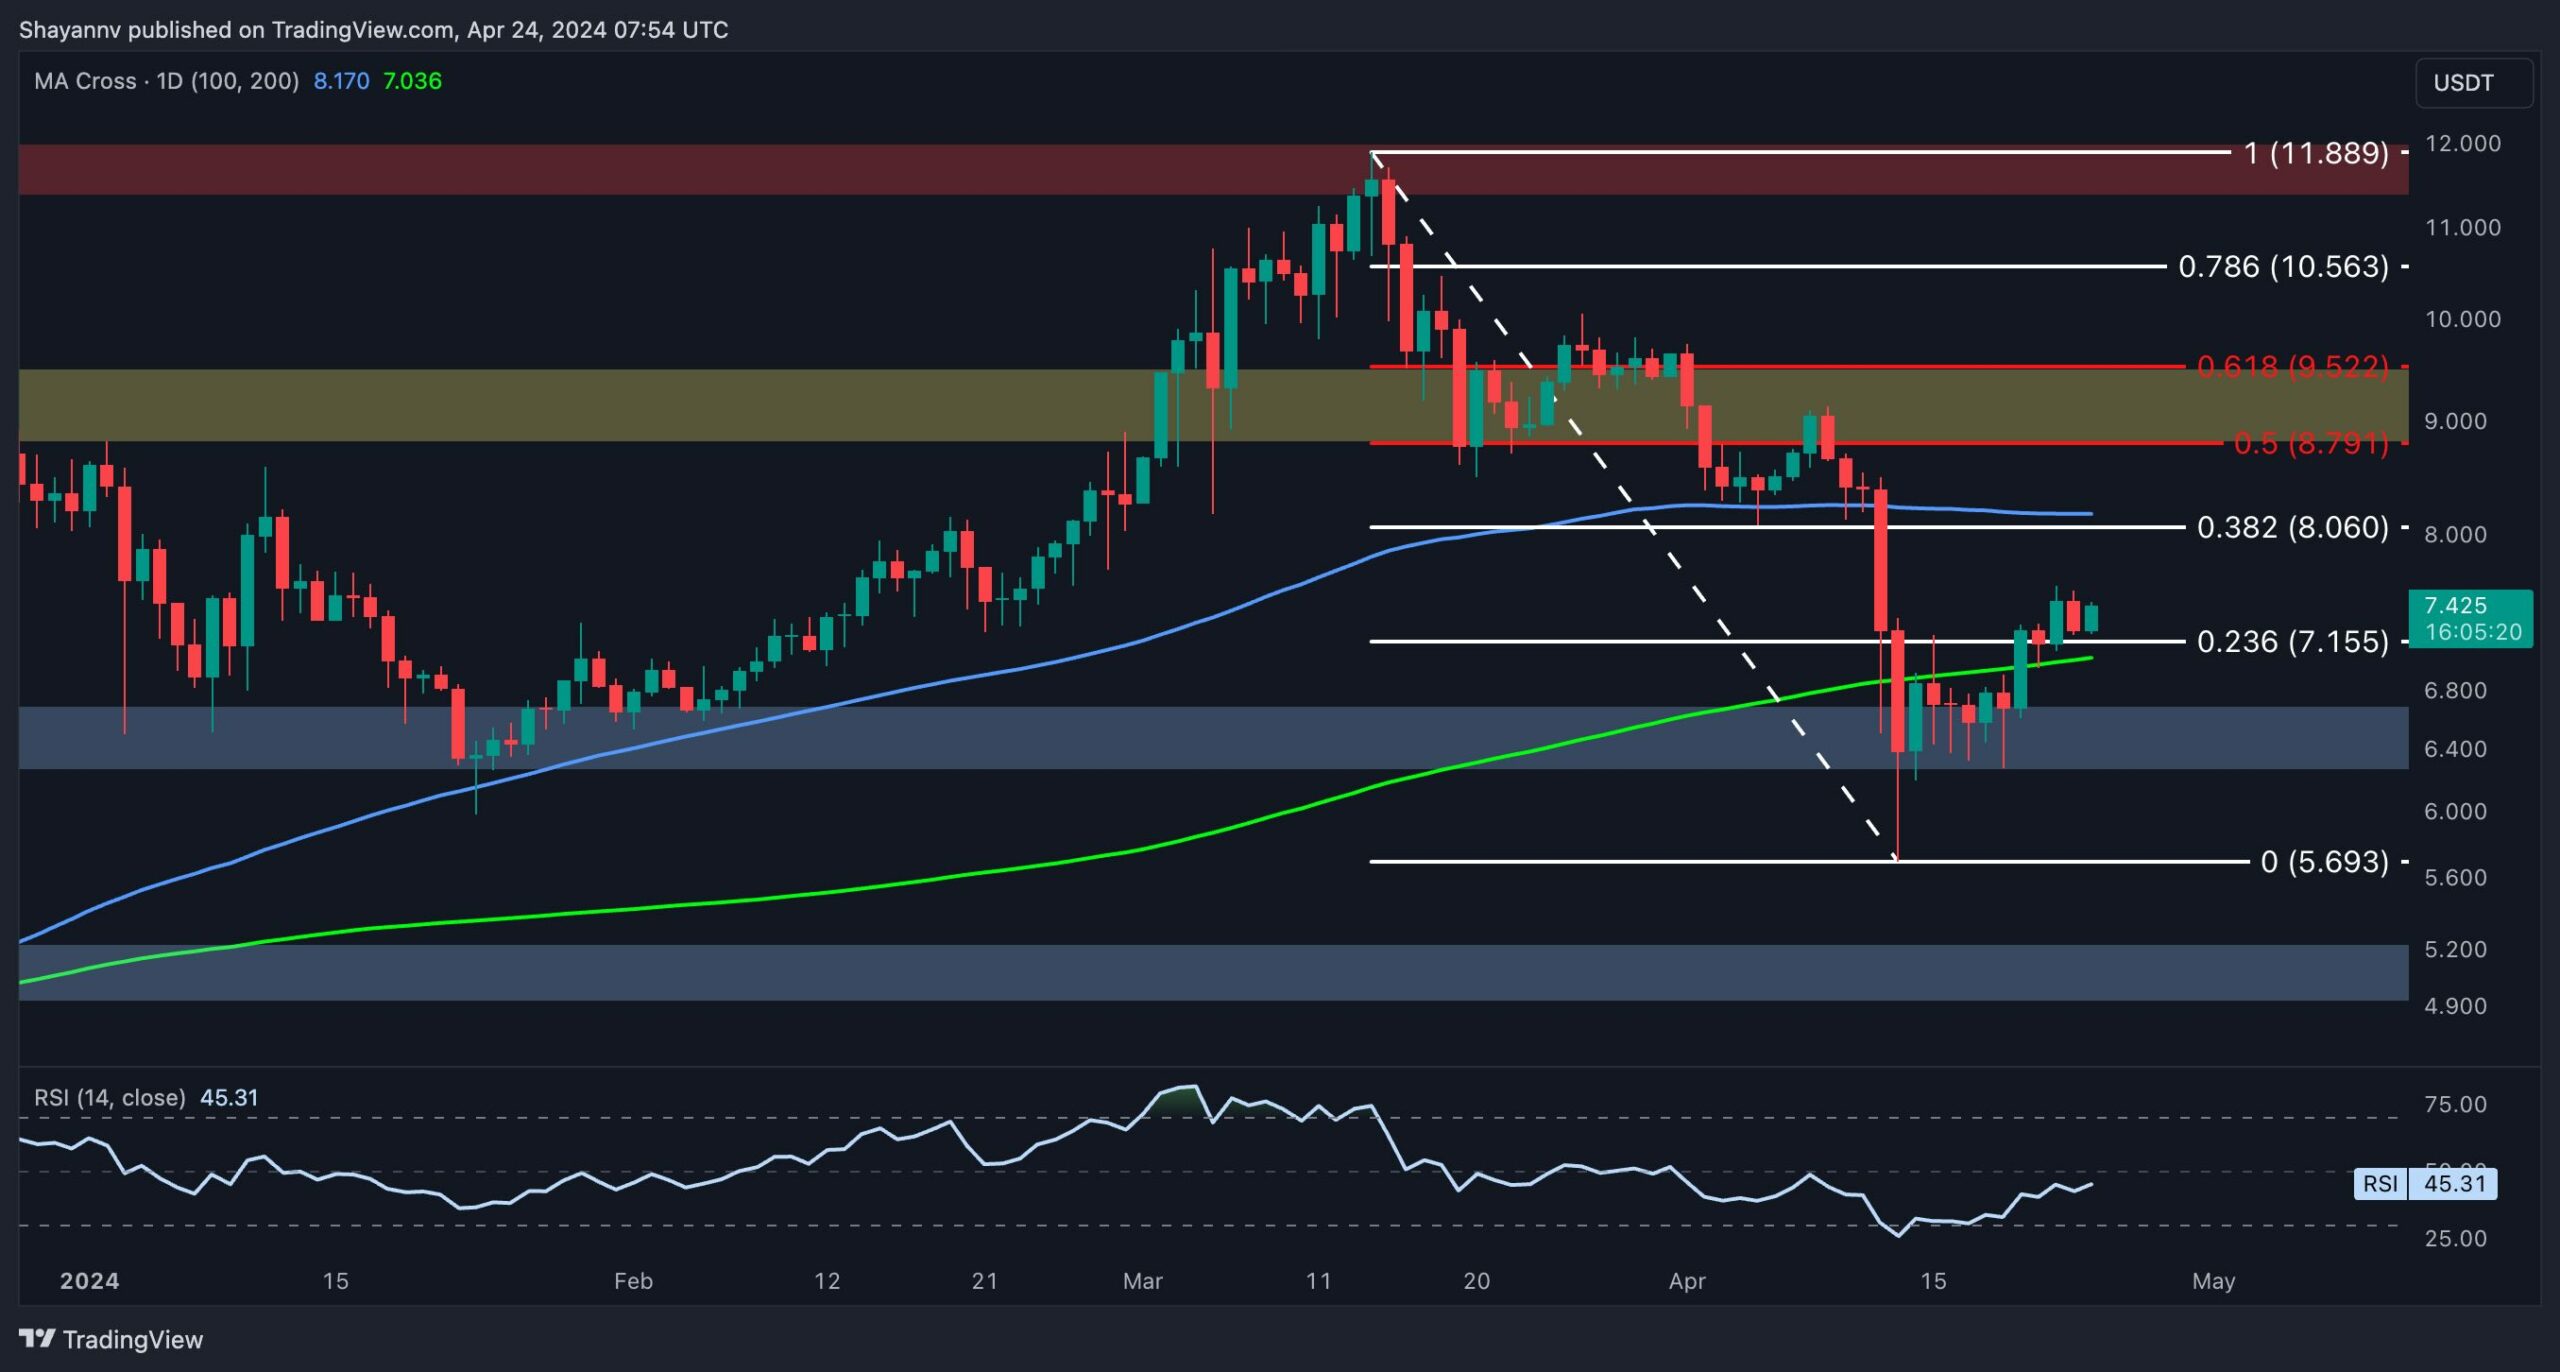
A thorough daily chart analysis reveals a modest bullish reversal near the key 200-day moving average of $7, following a quick decline in Polkadot’s price. However, the lack of substantial bullish momentum raises questions about the longevity of the recent action.
Additionally, significant resistance lies ahead. Notably, the 100-day moving average at $8.1 aligned with the 0.382 Fibonacci retracement level ($8), potentially hindering upward movement. These levels, combined with the crucial support from the 200-day MA, serve as pivotal reference points for Polkadot in the short term. A breakout from this critical range will likely determine the market’s next move.
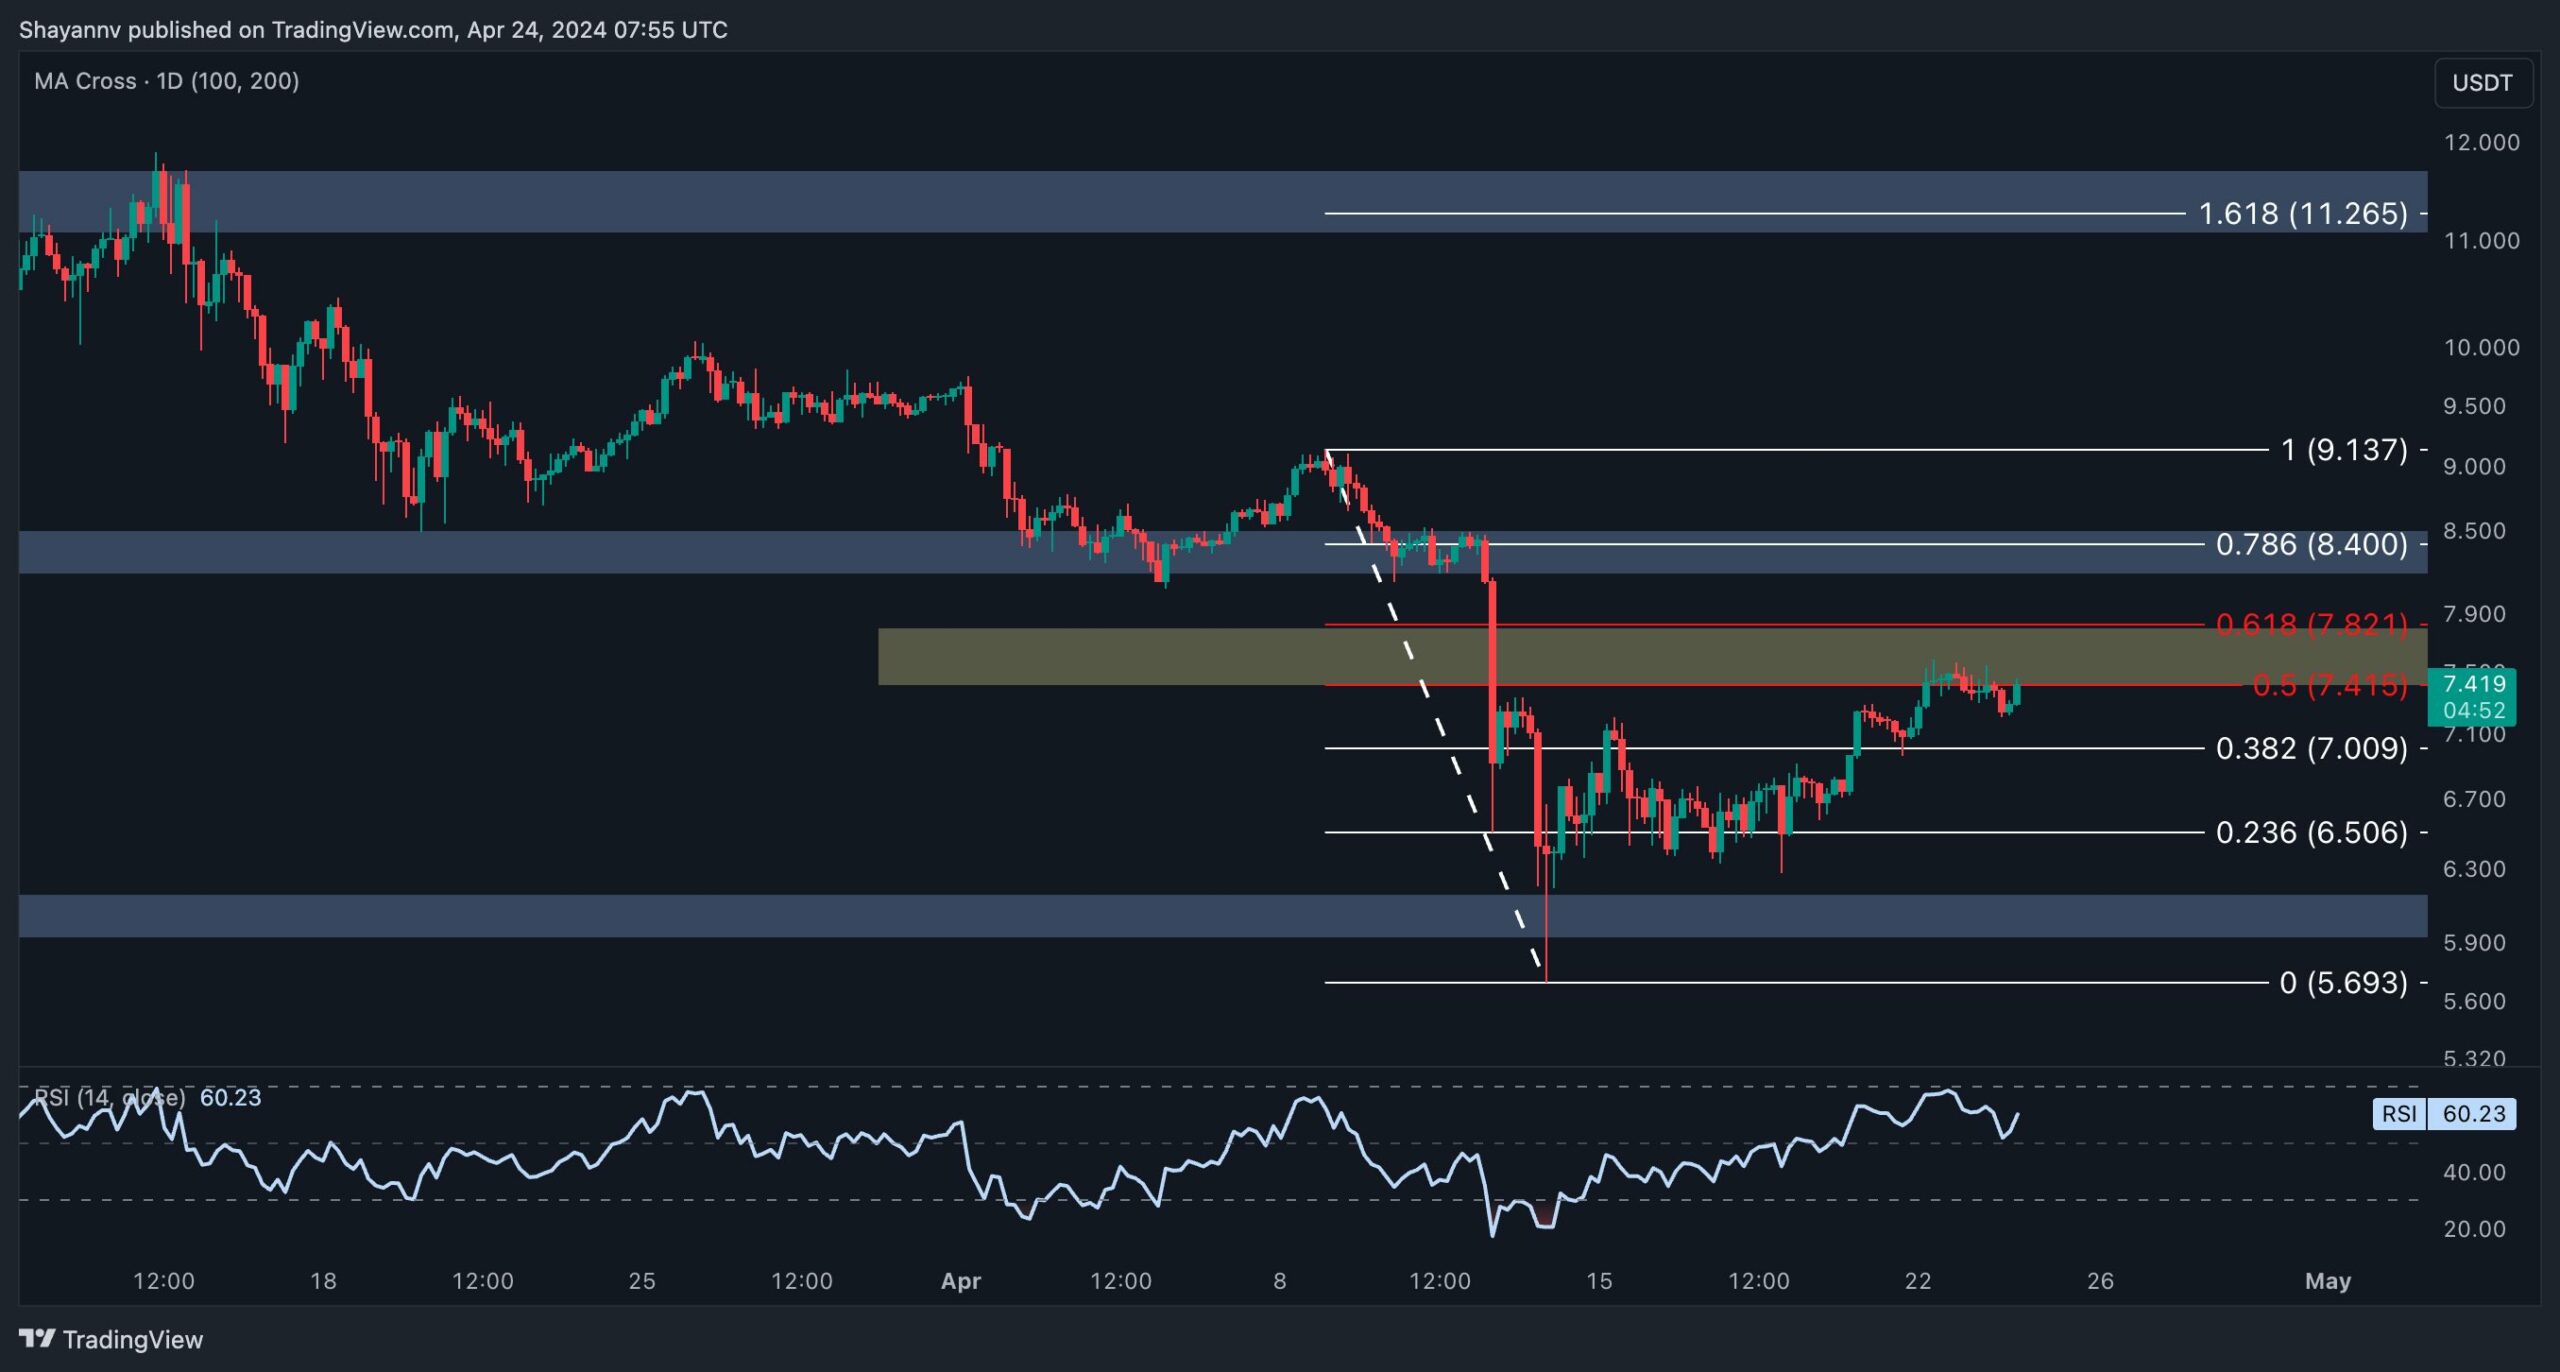
A closer examination of the 4-hour timeframe reveals a period of indecisive consolidation near the pivotal $6 mark, culminating in a notable bullish reversal. The subsequent surge in buying pressure propelled the price towards a significant resistance region, delineated by the 0.5 ($7.4) and 0.618 ($7.8) Fibonacci levels.
This critical range carries a substantial supply, making it an important area to monitor. Therefore, the price action in this region holds significant implications for Polkadot’s future trajectory. A breakthrough above this critical region would likely extend the current uptrend toward the critical resistance level at $9.
By Shayan
Polkadot’s recent price action has shown a bullish retracement, signaling a potential revival in positive sentiment. In light of this, it’s helpful to analyze futures market sentiment and liquidity levels to anticipate future market direction.
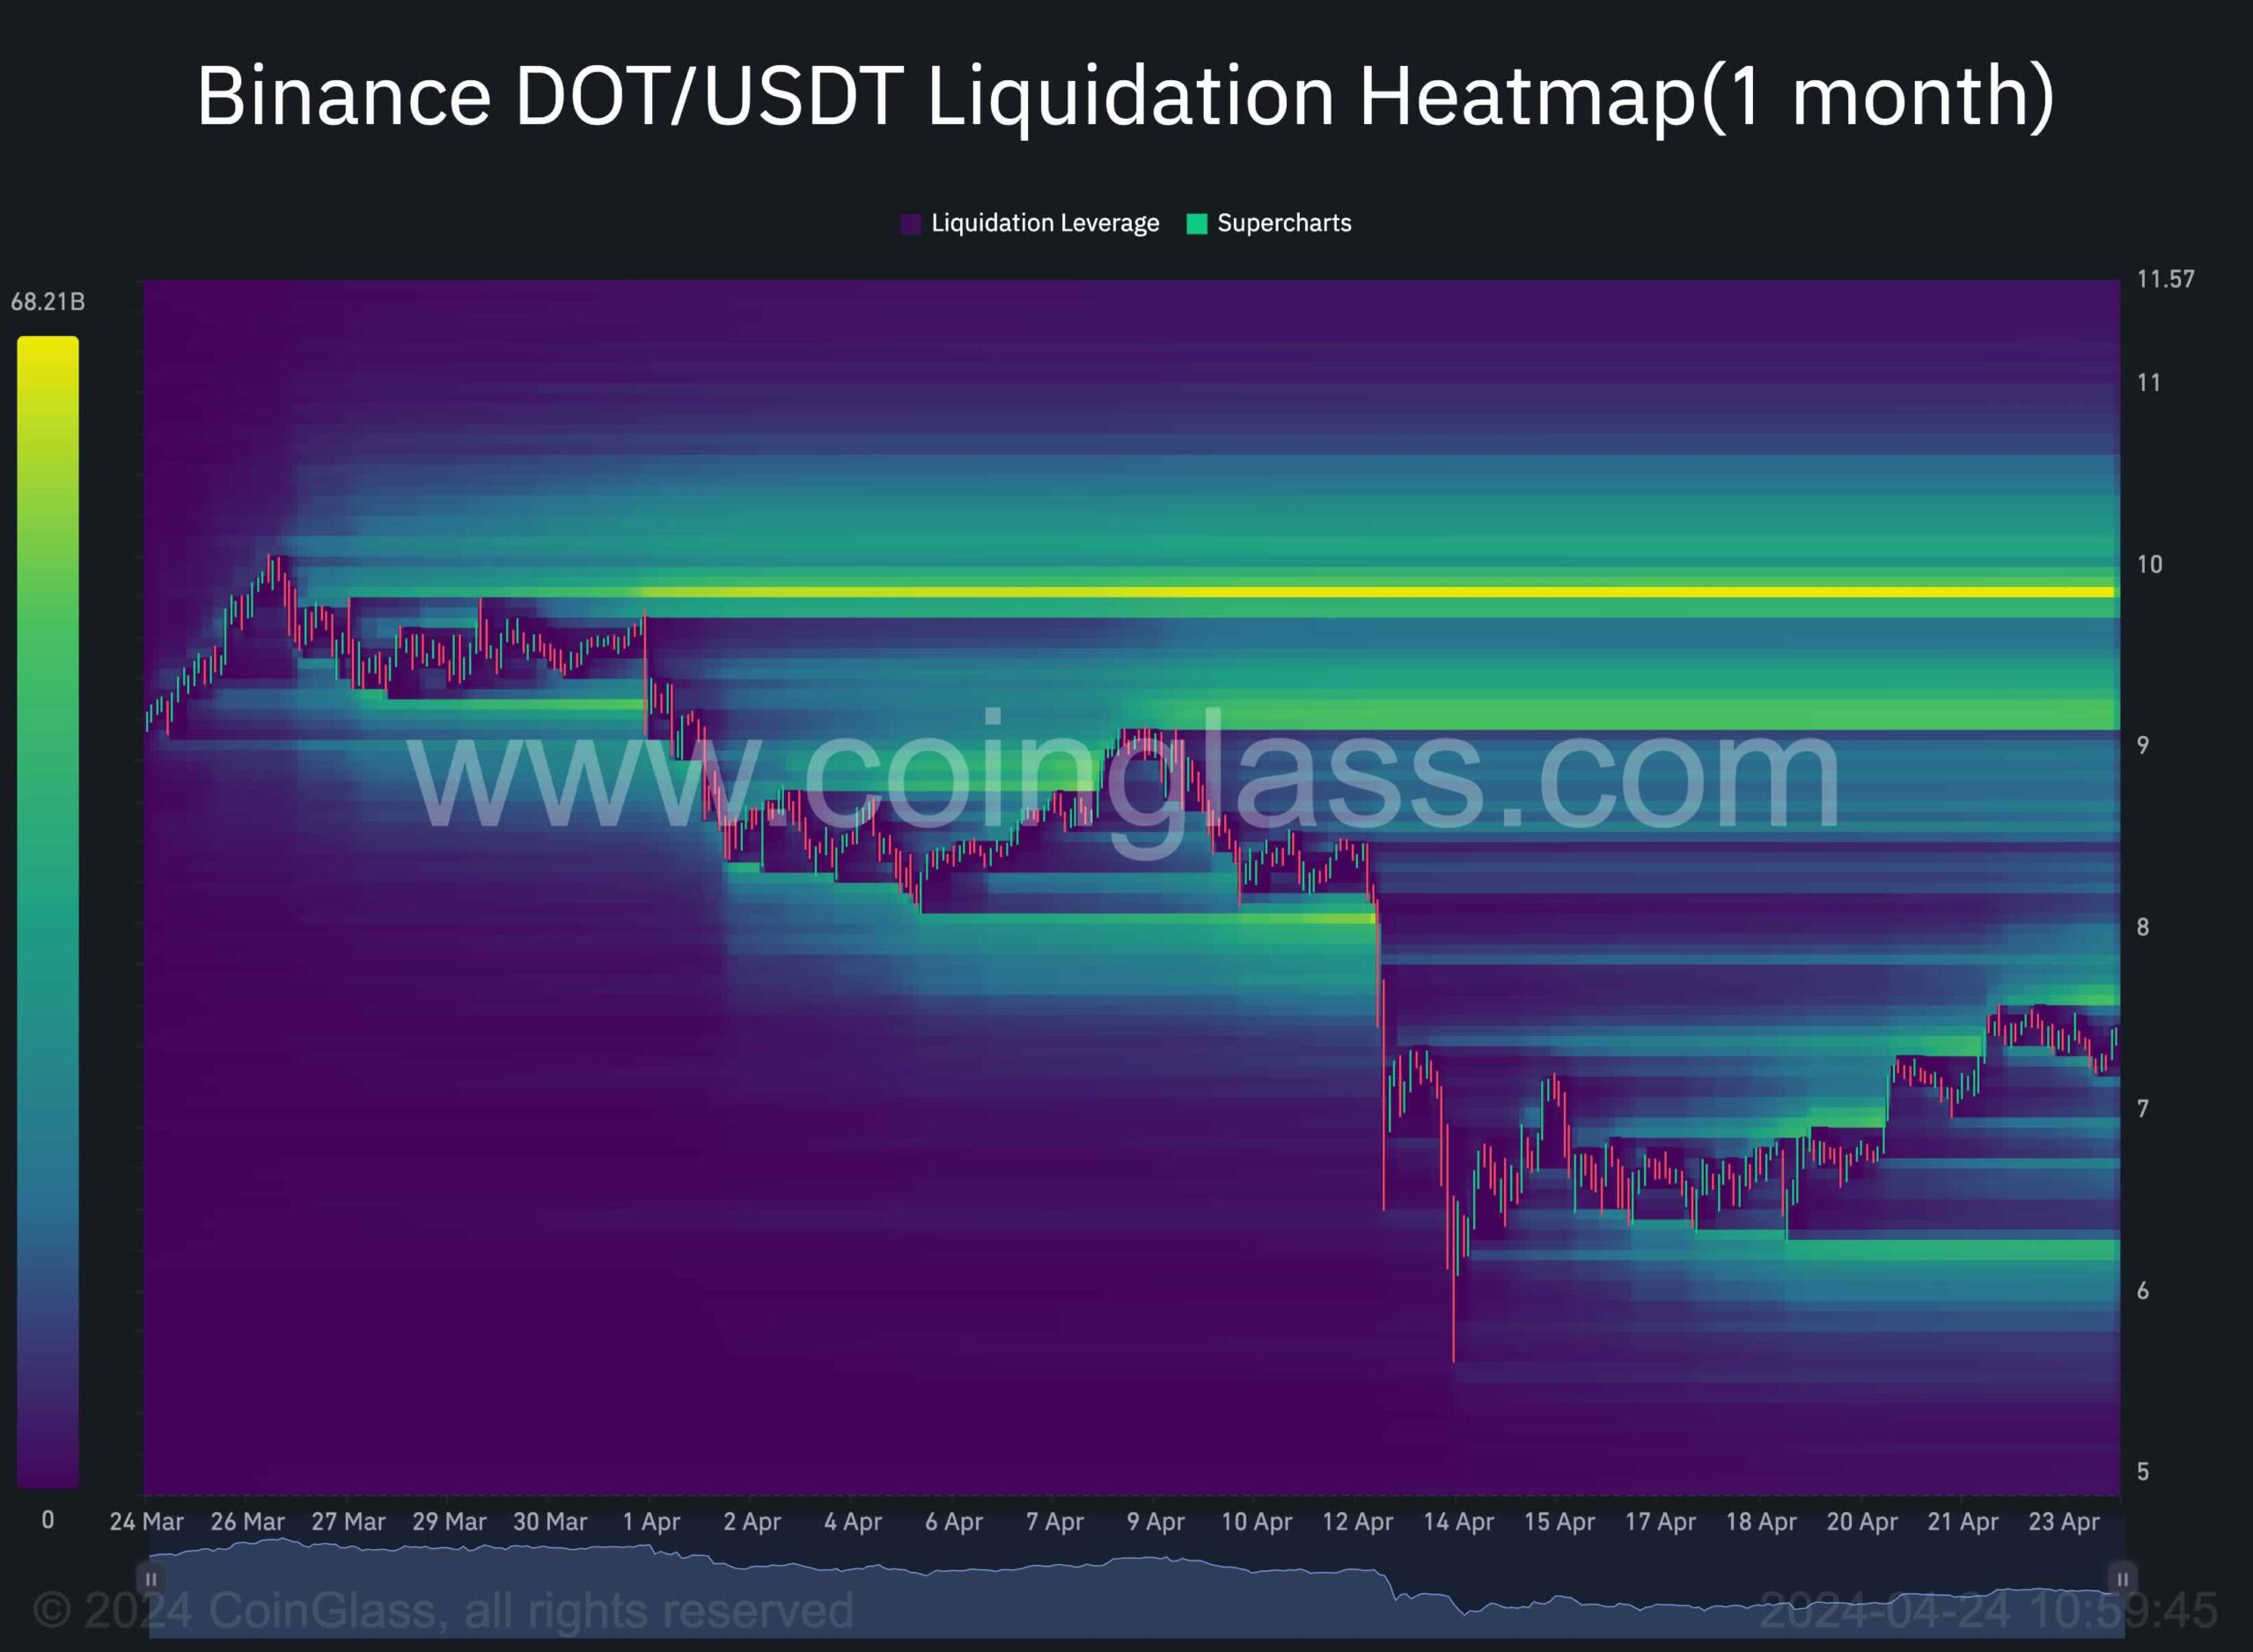
The accompanying chart depicts the Binance DOT/USDT heatmap, which predicts price levels where significant liquidation events may occur. When price levels indicate the likelihood of a liquidation cascade, highlighted in yellow, making these levels noteworthy support and resistance regions.
According to the chart, there is a notable concentration of liquidation levels above the $9 threshold, accompanied by many buy-stop orders. This suggests that the price will likely move towards the $9-$10 zone in the mid-term, with a notable liquidation of short positions expected.
The post Polkadot Price Analysis: DOT Consolidates in Critical Area as Bulls Eye $9 Push appeared first on CryptoPotato.
—
Blog powered by G6
Disclaimer! A guest author has made this post. G6 has not checked the post. its content and attachments and under no circumstances will G6 be held responsible or liable in any way for any claims, damages, losses, expenses, costs or liabilities whatsoever (including, without limitation, any direct or indirect damages for loss of profits, business interruption or loss of information) resulting or arising directly or indirectly from your use of or inability to use this website or any websites linked to it, or from your reliance on the information and material on this website, even if the G6 has been advised of the possibility of such damages in advance.
For any inquiries, please contact [email protected]


