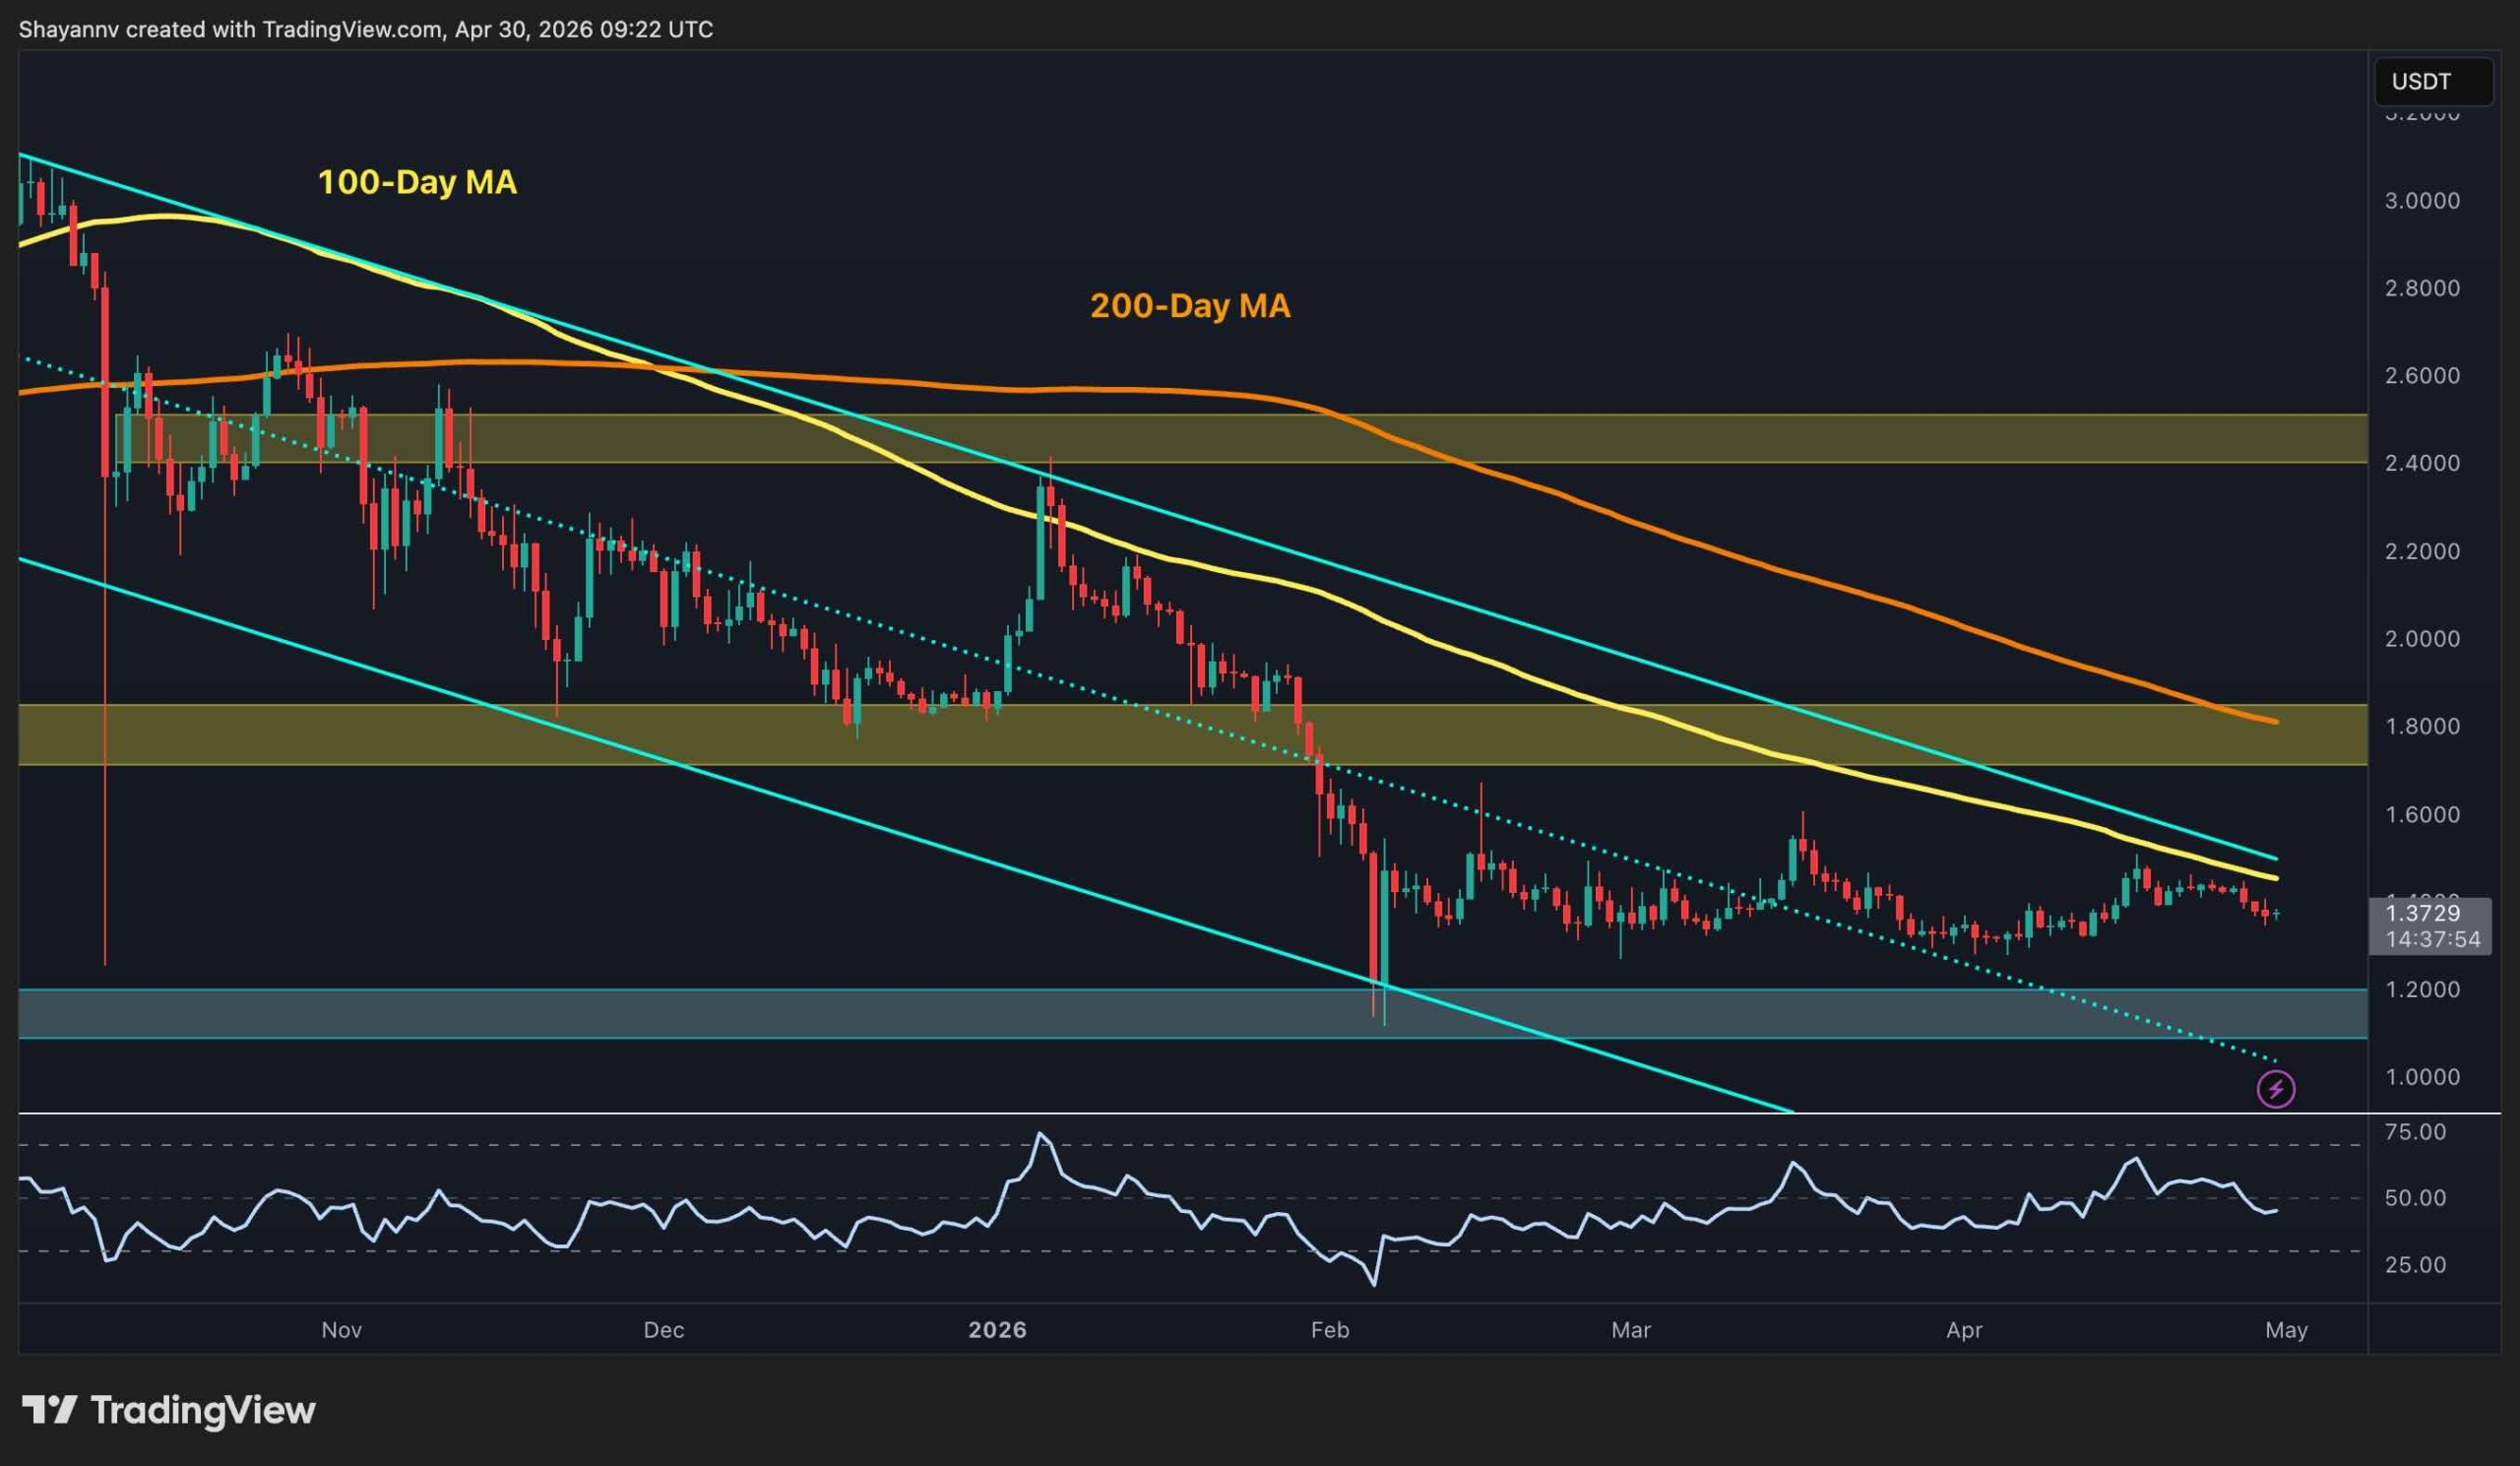
XRP is closing out April at $1.37, as it has surrendered the tentative momentum it built through the middle of the month. A promising RSI setup that had buyers eyeing a potential channel breakout less than a week ago has fully unwound, with the price reversing from below the upper channel boundary and drifting back toward the lower end of its range as May approaches. The rejection was clean and unambiguous, and it has reset the technical picture back to square one.
On the XRP/USDT pair, the setup that looked slightly constructive in mid-April has played out as a rejection rather than a breakout. XRP failed to post a sustained close above the channel ceiling and the 100-day moving average, and has since given back all of those gains, sliding from the $1.50 area back to $1.37. The RSI has also faded to below 50 in no-man’s land.
The 100-day MA at ~$1.50 and the 200-day MA converging with the $1.80 supply zone remain the levels that define the ceiling. Neither was seriously threatened lately. On the support side, the February wick low at $1.20 remains the hard floor. A close below this level would suggest XRP is now tracking toward the lower channel boundary rather than building for another breakout attempt, and would put the critical $1 support zone back in active focus heading into May.
Against Bitcoin, the picture has continued to deteriorate. XRP/BTC has slipped further to 1,800 sats, now sitting directly on the horizontal support level visible on the chart and slightly above the descending channel’s lower boundary at 1,600 sats. The RSI on this pair has also weakened below the 40 range, with the softest reading in several weeks. Unlike the USDT pair, which at least reached a neutral 50, the BTC ratio has shown no meaningful recovery attempt at any point during April.
The proximity to the lower channel boundary makes the next few daily closes significant. A breach of the 1,800 sats support level on a closing basis would represent a full channel breakdown and open the path toward the lower trendline and potentially the 1,500 sats support zone if selling pressure accelerates.
The 100-day MA at ~2,000 sats and the 200-day MA near 2,100 sats both sit far overhead and are still declining, confirming that XRP continues to bleed relative to Bitcoin regardless of what happens in dollar terms. A genuine ratio recovery requires, at minimum, a reclaim of the 2,000 sat level, and there is no technical evidence on this chart that such a move is imminent.

The post Ripple Price Analysis: XRP Sent Back to No Man’s Land After Clean Rejection appeared first on CryptoPotato.
—
Blog powered by G6
Disclaimer! A guest author has made this post. G6 has not checked the post. its content and attachments and under no circumstances will G6 be held responsible or liable in any way for any claims, damages, losses, expenses, costs or liabilities whatsoever (including, without limitation, any direct or indirect damages for loss of profits, business interruption or loss of information) resulting or arising directly or indirectly from your use of or inability to use this website or any websites linked to it, or from your reliance on the information and material on this website, even if the G6 has been advised of the possibility of such damages in advance.
For any inquiries, please contact [email protected]