Ripple’s price soared by almost 10% today before retracing to where it’s currently trading at. Now, let’s have a look at what this implies and where it might be headed next.
By Edris
Ripple’s price has recently risen, leaving investors wondering if a new bullish trend is on the horizon. However, there is still an important resistance level to overcome.
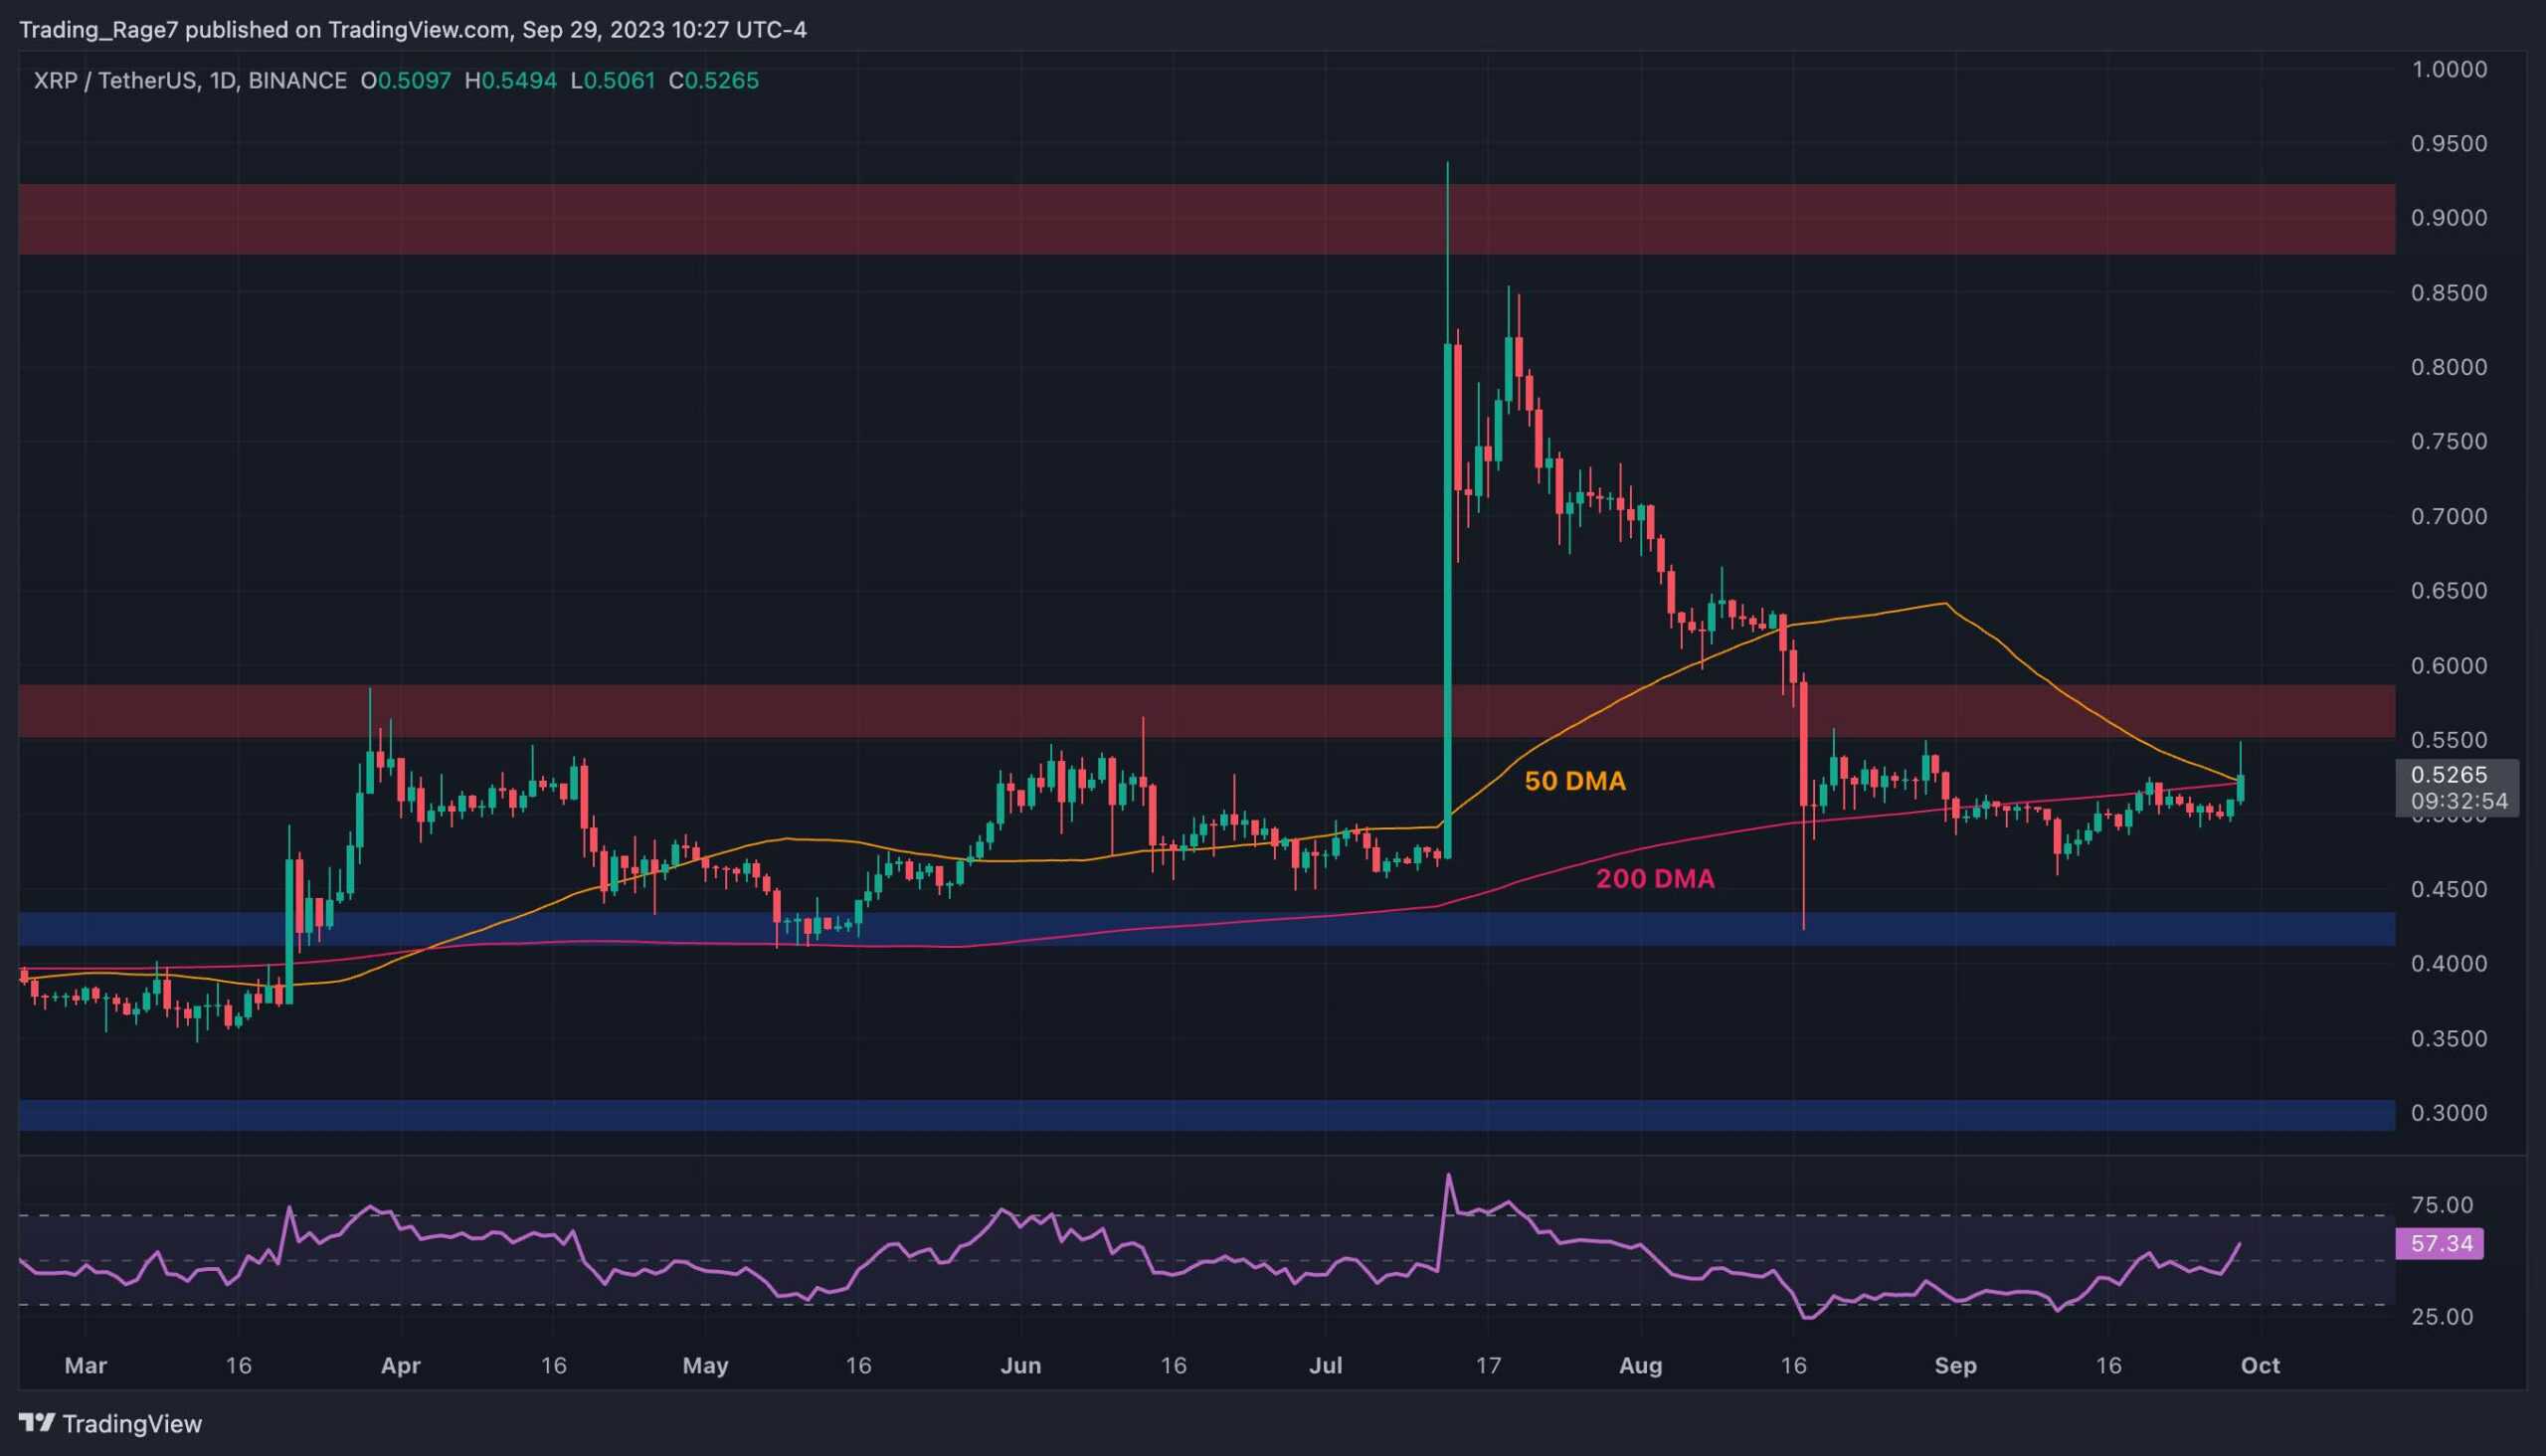
On the USDT paired chart, the price is breaking above both the 50-day and 200-day moving averages, converging around the $0.52 mark.
If the market holds above this area, the key resistance level of $0.55 would be the next target. Breaking out from this level would initiate a new rally in XRP’s price, with the market likely to move towards the $0.9 level in the coming months.
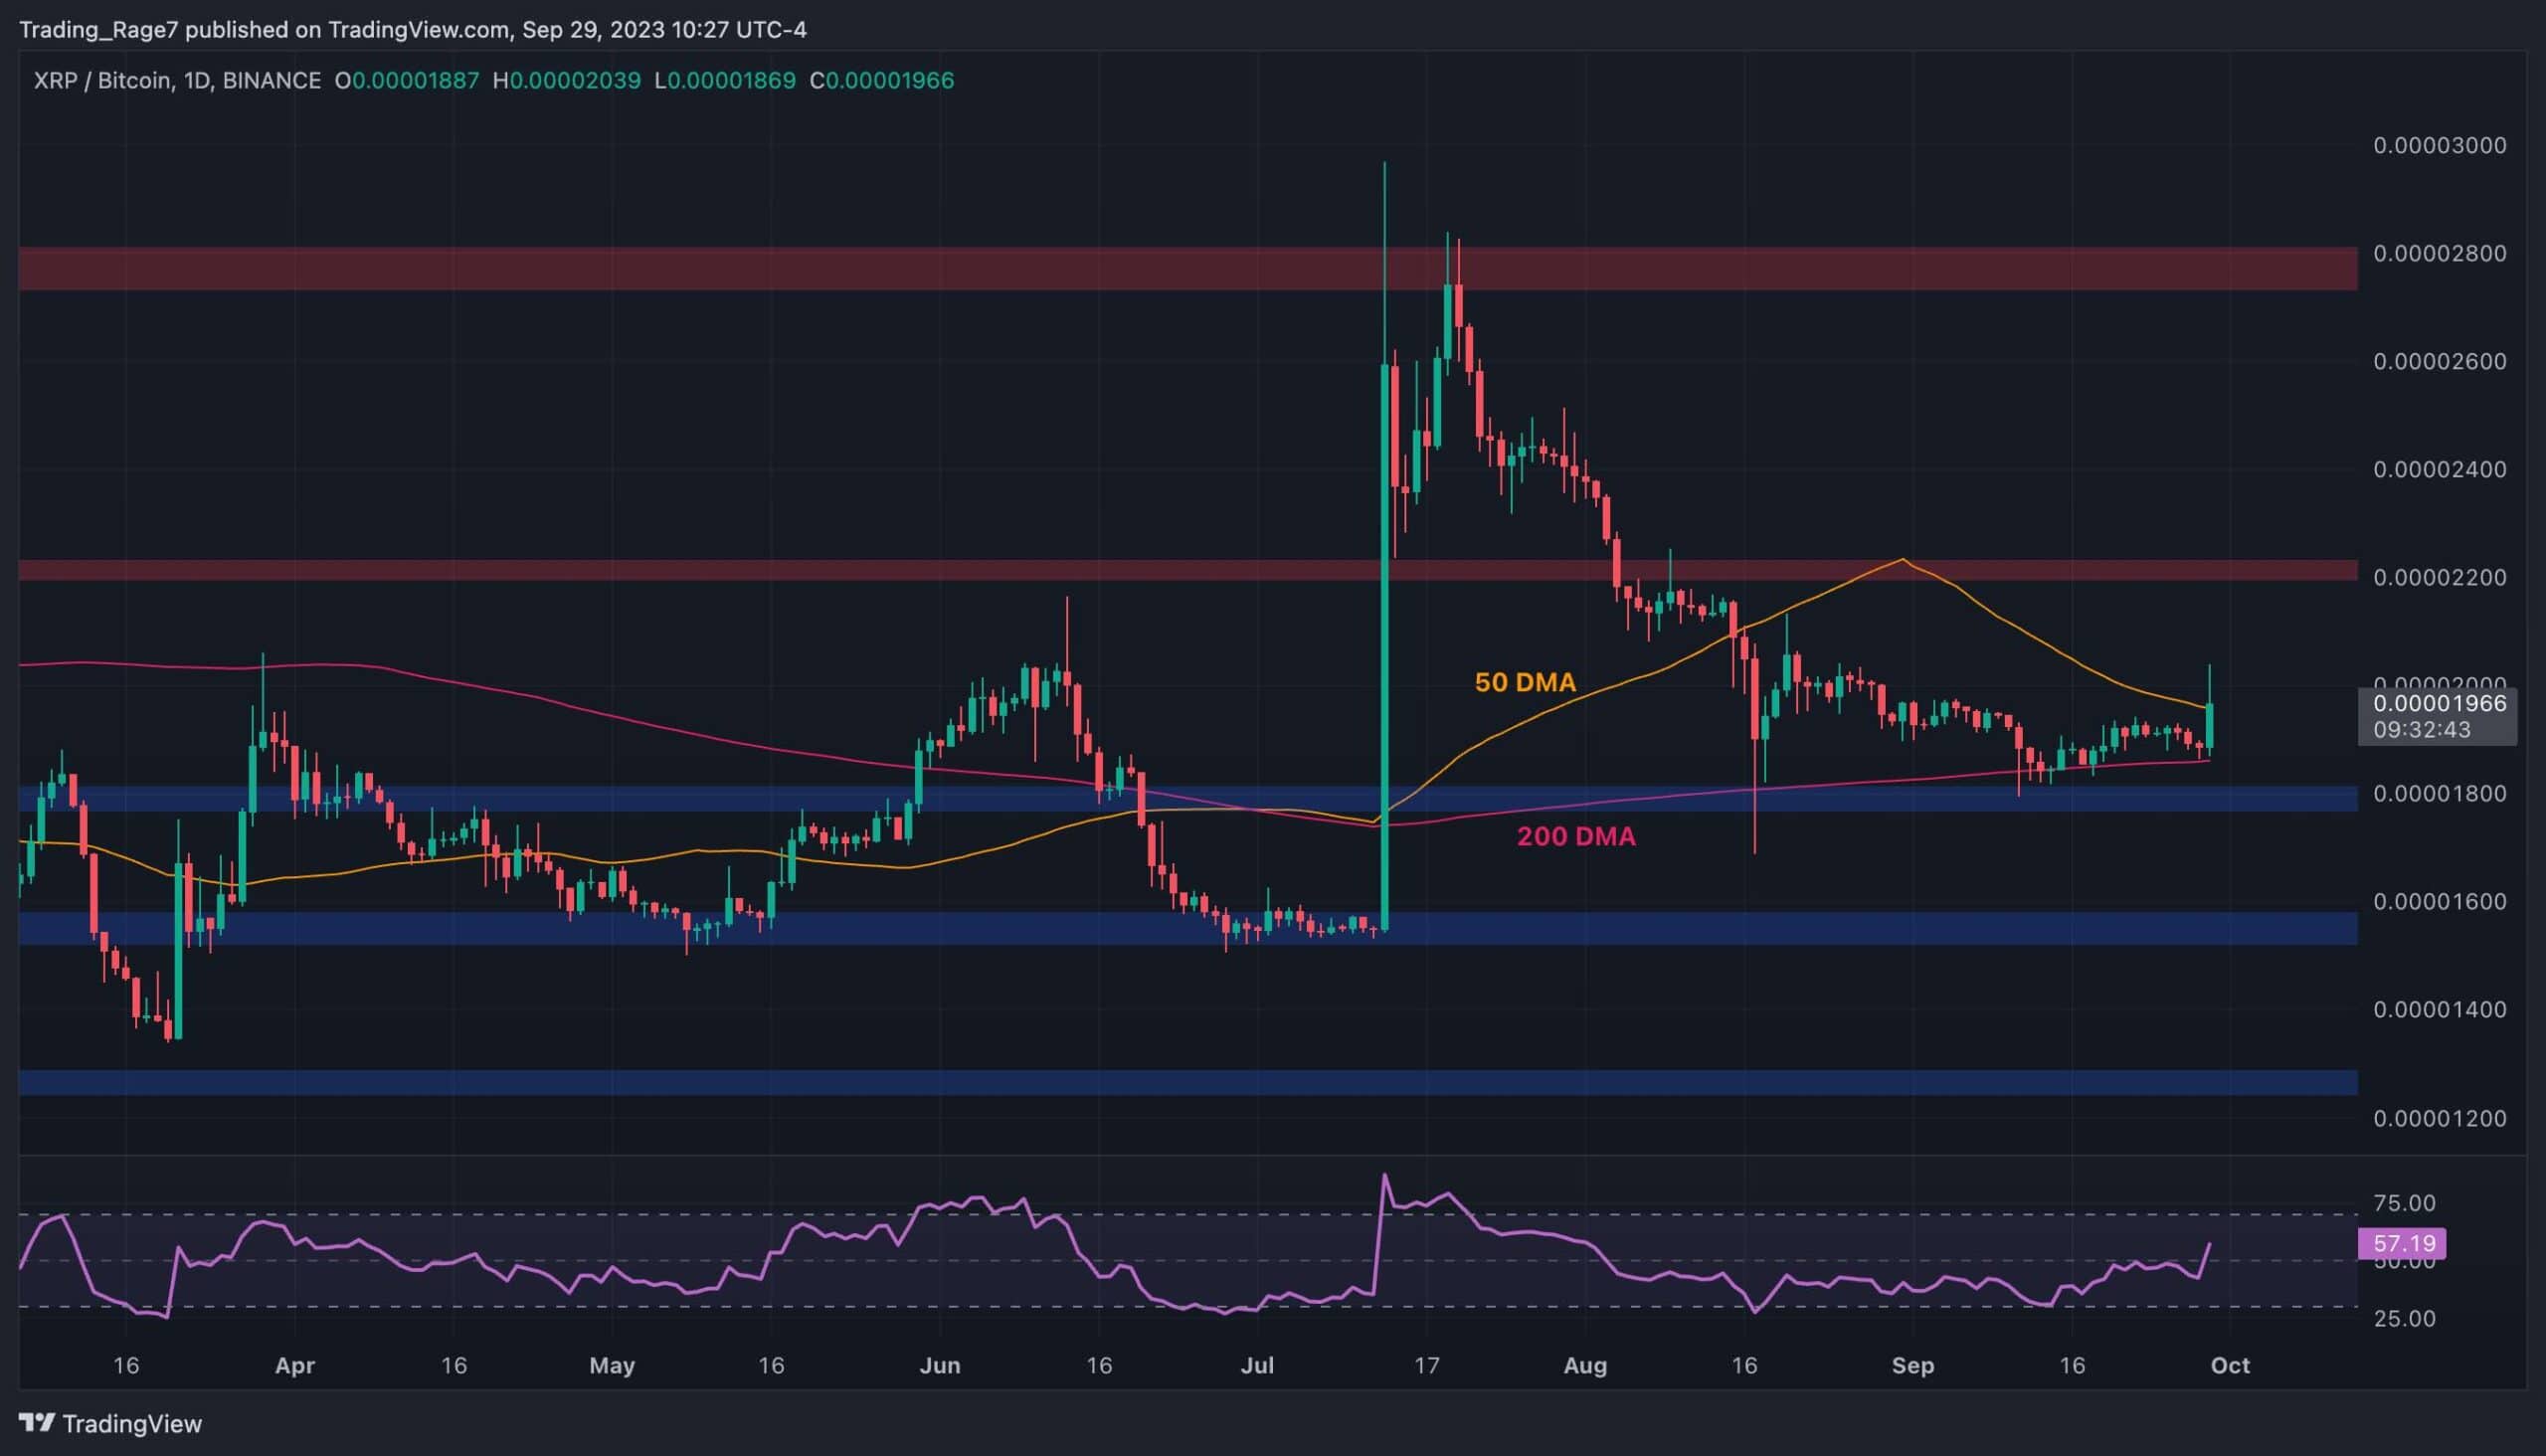
Looking at the BTC paired chart, the situation appears similar. The price has been supported by the 200-day moving average and is climbing above the 50-day moving average around the 2000 SAT mark.
A successful bullish breakout would pave the way for the price to surge towards the 2200 SAT zone in the short term. The RSI indicator has also broken above the 50% threshold, indicating that momentum is in favor of the buyers.
The post Ripple Surprises with Massive Move: Here’s the Most Important Target (XRP Price Analysis) appeared first on CryptoPotato.
—
Blog powered by G6
Disclaimer! A guest author has made this post. G6 has not checked the post. its content and attachments and under no circumstances will G6 be held responsible or liable in any way for any claims, damages, losses, expenses, costs or liabilities whatsoever (including, without limitation, any direct or indirect damages for loss of profits, business interruption or loss of information) resulting or arising directly or indirectly from your use of or inability to use this website or any websites linked to it, or from your reliance on the information and material on this website, even if the G6 has been advised of the possibility of such damages in advance.
For any inquiries, please contact [email protected]


