Solana rallied above the $50 resistance against the US Dollar. SOL price is consolidating gains above $55 and might extend its rally above $65.
SOL price started a major rally above the $50 resistance against the US Dollar.
The price is now trading above $55 and the 100 simple moving average (4 hours).
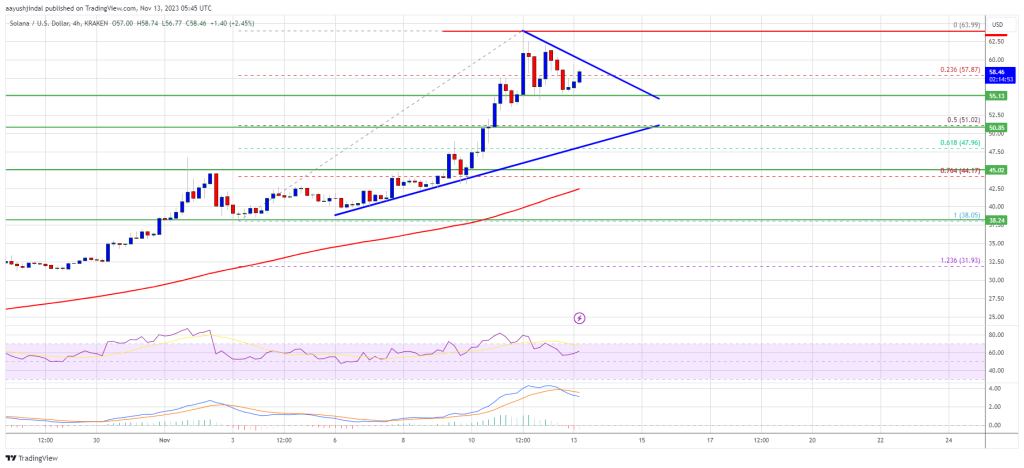
There is a key contracting triangle forming with support near $51.00 on the 4-hour chart of the SOL/USD pair (data source from Kraken).
The pair could restart its rally if it clears the $60.00 resistance zone.
In the past few days, Solana saw a major rally above the $40 level. SOL gained bullish momentum and cleared many hurdles near the $50, outperforming Bitcoin and Ethereum.
It even surged above the $55 and $60 levels. A new multi-week high was formed near $63.99 before the price started a minor downside correction. There was a move below the $60 level. The price declined below the 23.6% Fib retracement level of the upward move from the $38.05 swing low to the $63.99 high.
SOL is now trading above $55 and the 100 simple moving average (4 hours). There is also a key contracting triangle forming with support near $51.00 on the 4-hour chart of the SOL/USD pair.
Source: SOLUSD on TradingView.com
On the upside, immediate resistance is near the $60.00 level. The first major resistance is near the $65.00 level. A successful close above the $65.00 resistance could set the pace for a larger increase. The next key resistance is near $70.00. Any more gains might send the price toward the $75.00 level.
If SOL fails to recover above the $60.00 resistance, it could start a downside correction. Initial support on the downside is near the $55.00 level.
The first major support is near the $51.00 level, the trend line zone, and the 50% Fib retracement level of the upward move from the $38.05 swing low to the $63.99 high. If there is a close below the $51.00 support, the price could decline toward the $45.00 support in the near term.
Technical Indicators
4-Hours MACD – The MACD for SOL/USD is gaining pace in the bullish zone.
4-Hours RSI (Relative Strength Index) – The RSI for SOL/USD is above the 50 level.
Major Support Levels – $55.00, and $51.00.
Major Resistance Levels – $60.00, $65.00, and $75.00.
—
Blog powered by G6
Disclaimer! A guest author has made this post. G6 has not checked the post. its content and attachments and under no circumstances will G6 be held responsible or liable in any way for any claims, damages, losses, expenses, costs or liabilities whatsoever (including, without limitation, any direct or indirect damages for loss of profits, business interruption or loss of information) resulting or arising directly or indirectly from your use of or inability to use this website or any websites linked to it, or from your reliance on the information and material on this website, even if the G6 has been advised of the possibility of such damages in advance.
For any inquiries, please contact [email protected]


