Solana started a fresh increase from the $165 zone. SOL price is showing signs of strength and might climb further above the $182.50 resistance.
SOL price started a decent upward move from the $165 support against the US Dollar.
The price is now trading near $175 and the 100-hourly simple moving average.
There was a break above a connecting bearish trend line with resistance at $170 on the hourly chart of the SOL/USD pair (data source from Kraken).
The pair could aim for more upsides if it clears the $182.50 resistance level.
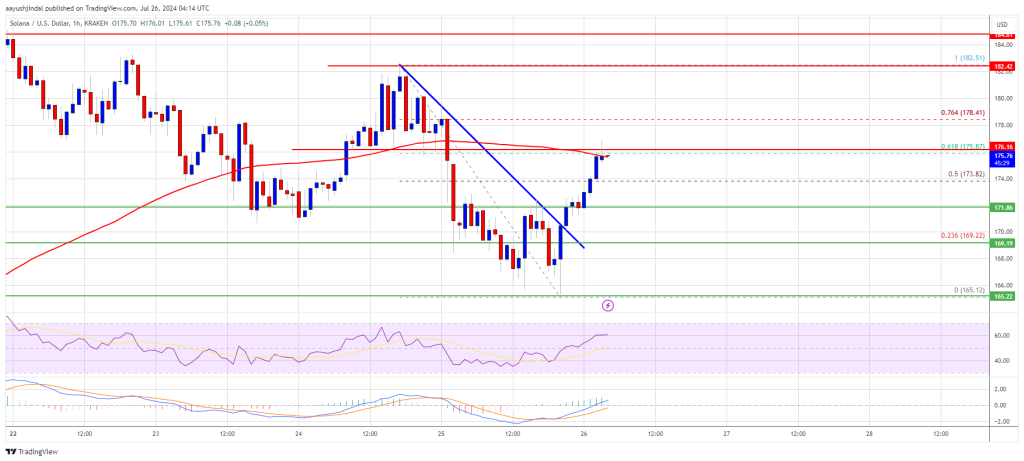
Solana price started a downside correction from $152.50 like Bitcoin and Ethereum. It traded below the $175 and $172 support levels. There was a drop below the $170 level.
Finally, it tested the $165 support. A low is formed at $165.12 and the price is again rising. There was a break above the $170 and $172 resistance levels. The price surpassed the 50% Fib retracement level of the downward move from the $182.51 swing high to the $165.12 low.
Besides, there was a break above a connecting bearish trend line with resistance at $170 on the hourly chart of the SOL/USD pair. Solana is now trading near the $175 level. It seems to be struggling near the 61.8% Fib retracement level of the downward move from the $182.51 swing high to the $165.12 low.
On the upside, the price is facing resistance near the $175 level. The next major resistance is near the $182.50 level. A successful close above the $182.50 resistance could set the pace for another steady increase. The next key resistance is near $192. Any more gains might send the price toward the $200 level.
If SOL fails to rise above the $182.50 resistance, it could start another decline. Initial support on the downside is near the $172 level. The first major support is near the $170 level.
A break below the $170 level might send the price toward $165. If there is a close below the $165 support, the price could decline toward the $155 support in the near term.
Technical Indicators
Hourly MACD – The MACD for SOL/USD is gaining pace in the bullish zone.
Hourly Hours RSI (Relative Strength Index) – The RSI for SOL/USD is above the 50 level.
Major Support Levels – $172 and $170.
Major Resistance Levels – $175 and $182.50.
—
Blog powered by G6
Disclaimer! A guest author has made this post. G6 has not checked the post. its content and attachments and under no circumstances will G6 be held responsible or liable in any way for any claims, damages, losses, expenses, costs or liabilities whatsoever (including, without limitation, any direct or indirect damages for loss of profits, business interruption or loss of information) resulting or arising directly or indirectly from your use of or inability to use this website or any websites linked to it, or from your reliance on the information and material on this website, even if the G6 has been advised of the possibility of such damages in advance.
For any inquiries, please contact [email protected]


