Ethereum is attempting a recovery after bouncing from the $1,800 zone, but the price remains trapped below key resistance, and the broader trend is still bearish. Short-term momentum has improved slightly, but upside continuation remains uncertain.
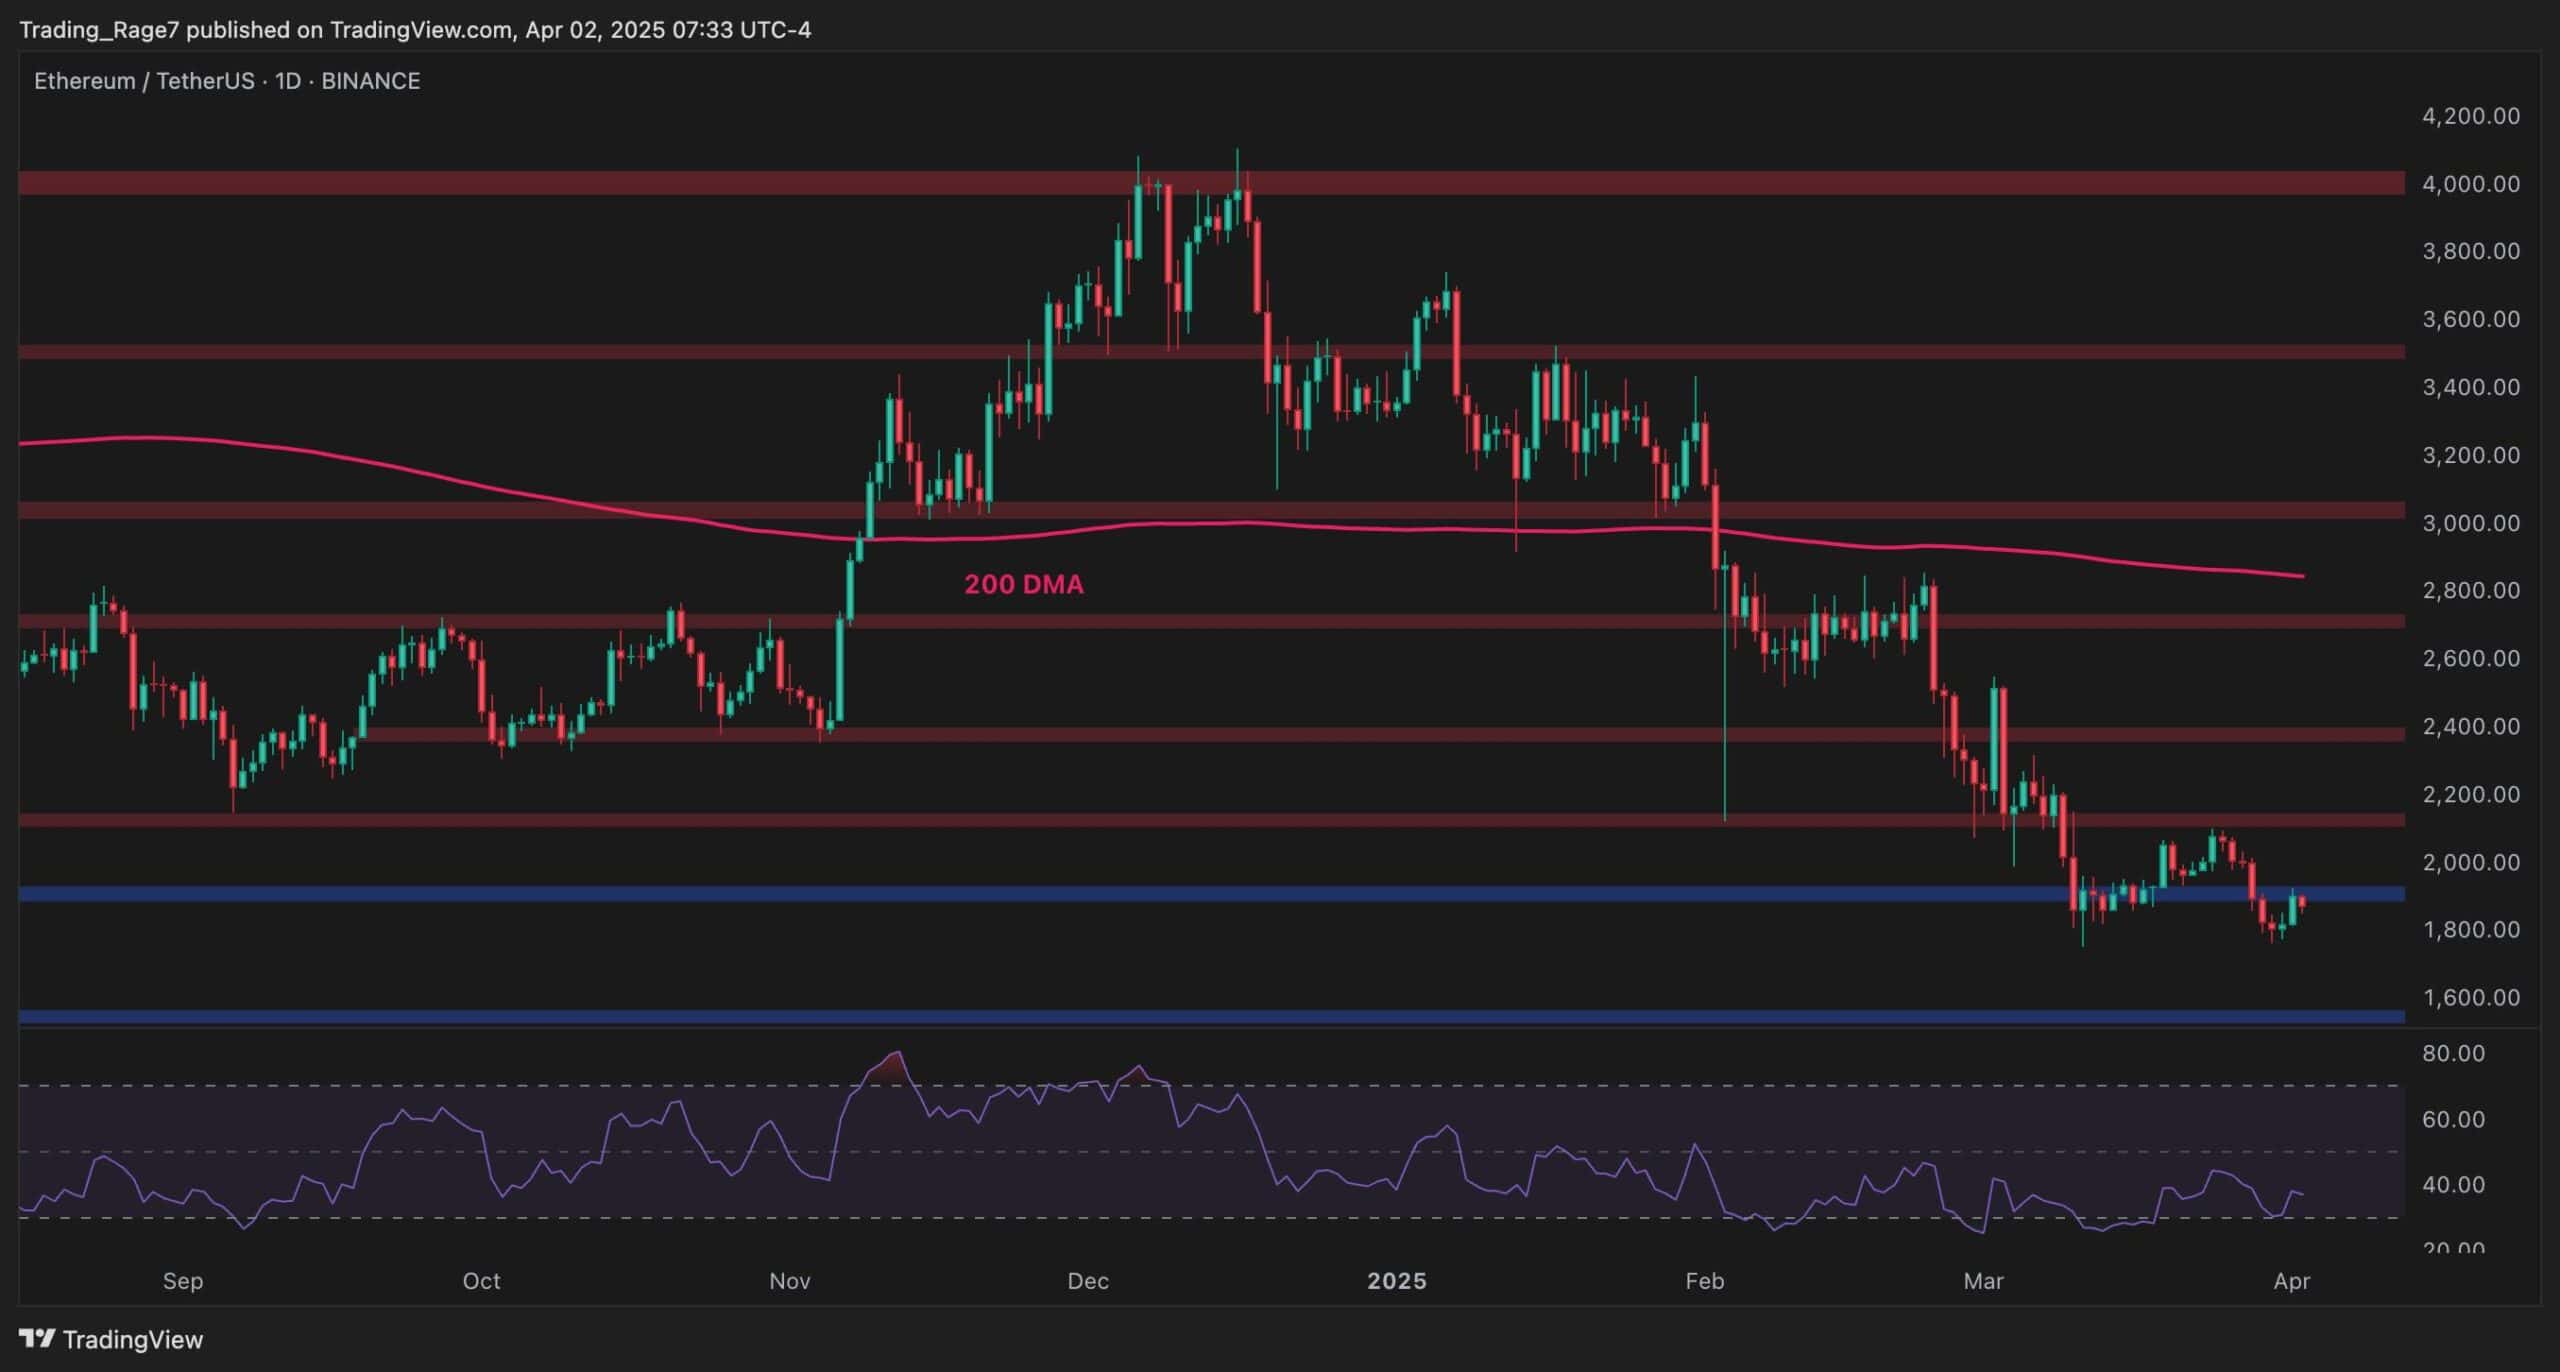
The daily chart shows ETH stabilizing around the $1,900 area following a sharp rejection from the $2,200 zone in late March. The asset remains well below the 200-day moving average, which continues to slope downward around the $2,800 region, confirming bearish market structure on a macro level.
The most recent bounce has taken the price back into the $1,900 resistance zone, but the buyers are yet to show strong follow-through. The RSI is also rebounding from oversold levels, suggesting short-term relief, but there is no bullish divergence or momentum breakout to support a sustainable trend reversal. A decisive daily close above $1,950–$2,000 would be the first signal that buyers are regaining control.
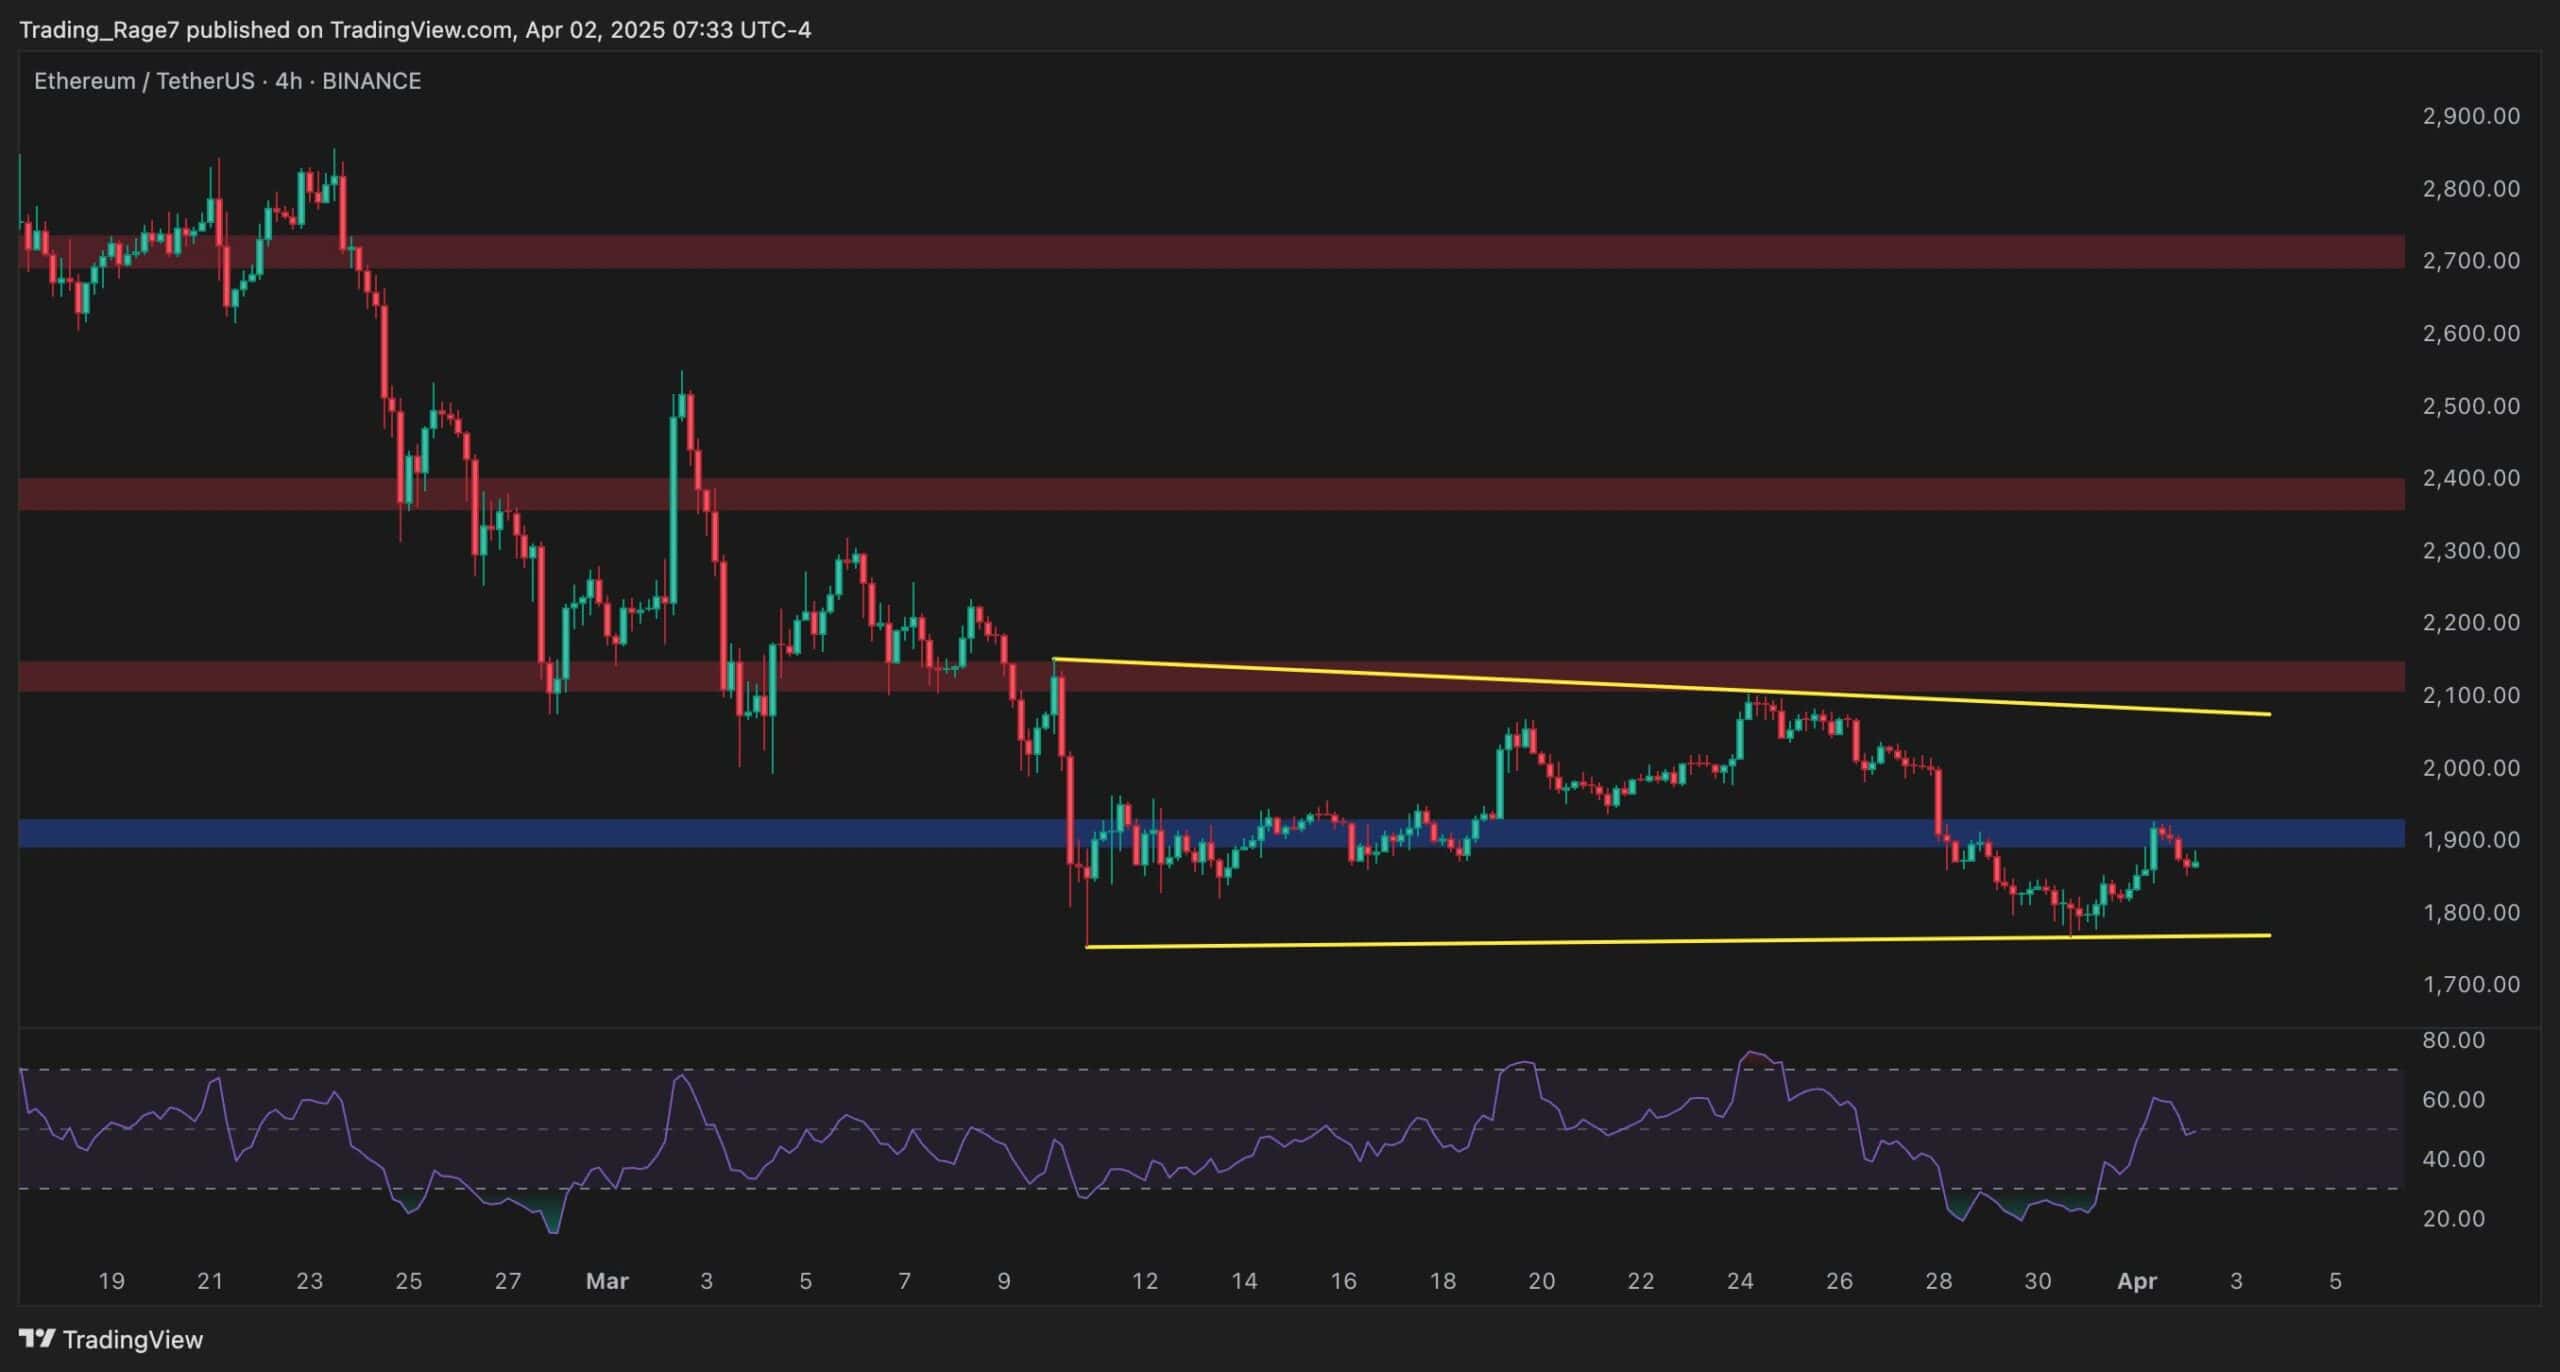
On the 4-hour timeframe, ETH is trading within a horizontal consolidation pattern, with the lower boundary at $1,800 and the higher one near the $2,200 region. After the recent sell-off, the price rebounded into the $1,900 supply zone but faced immediate resistance and is now pulling back slightly.
Moreover, RSI hit near-overbought conditions during the bounce and is now cooling off, indicating potential consolidation or another retest of the $1,800 area. If ETH fails to break out above the higher boundary of the pattern, another leg down to sweep the $1,780–$1,750 liquidity becomes more likely. A confirmed breakout above $2,200, however, would invalidate the pattern and suggest a short-term bullish reversal.
By Edris Derakhshi (TradingRage)
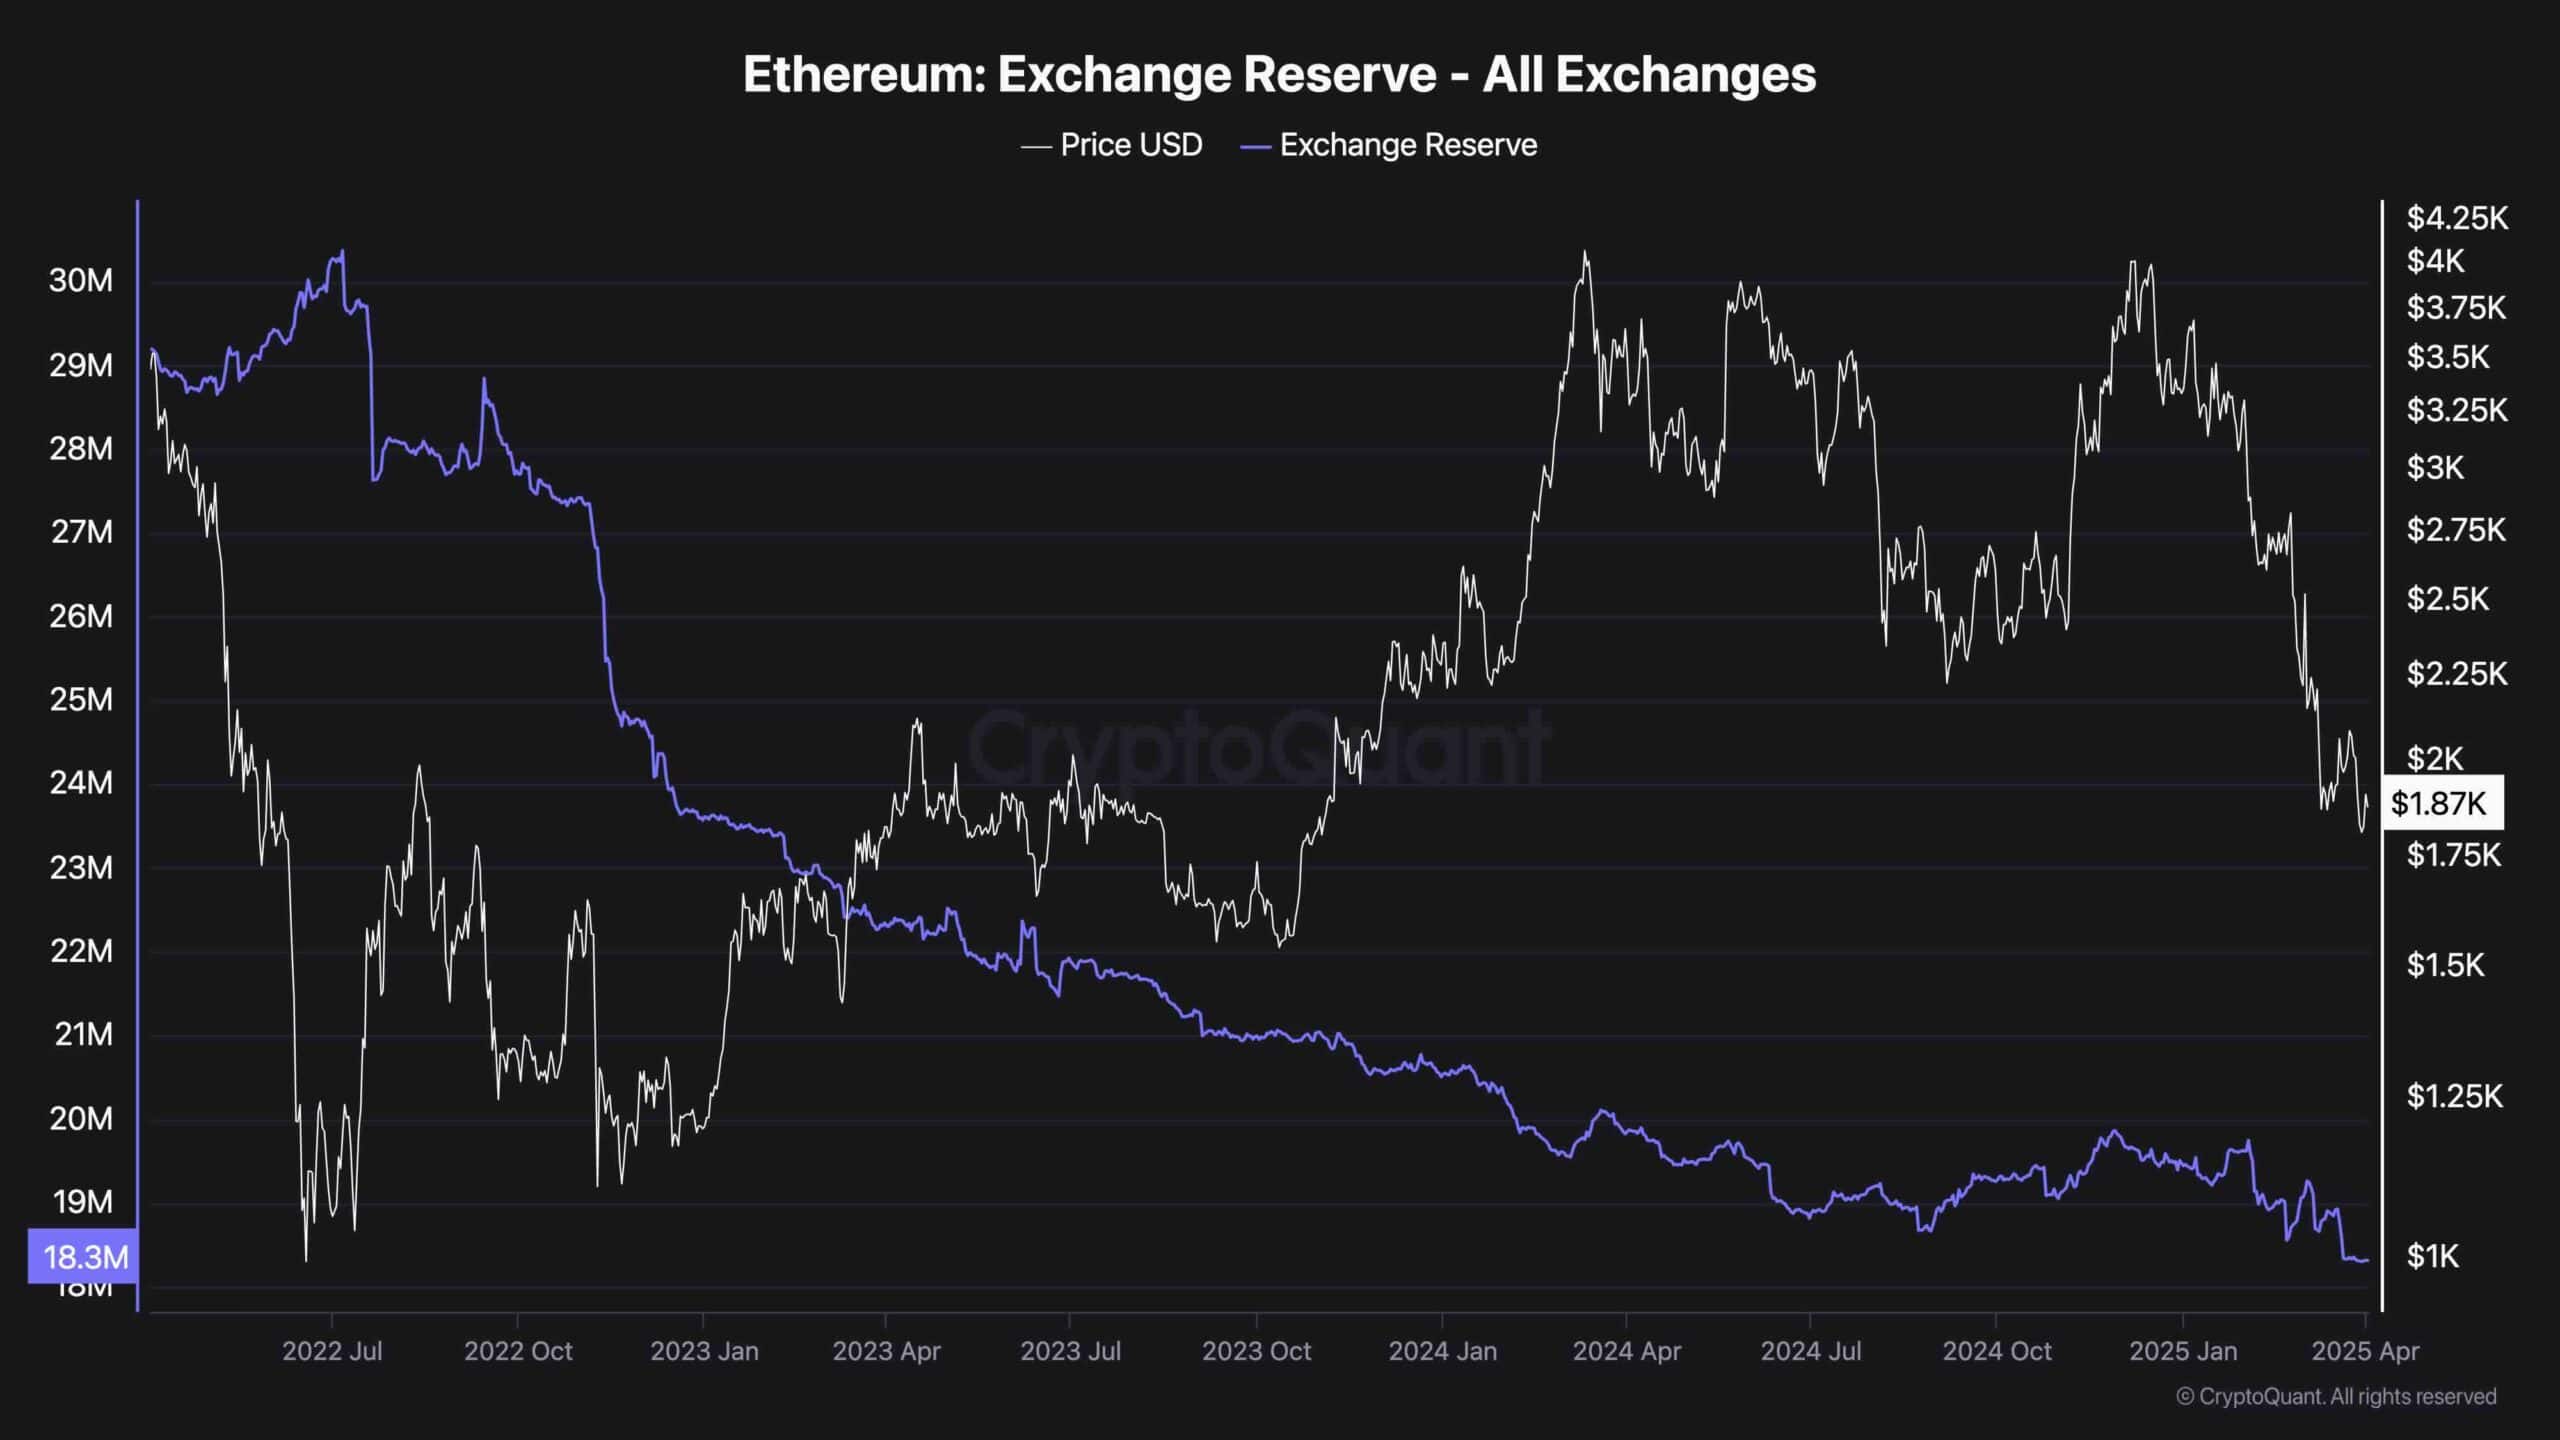
Ethereum’s exchange reserve has continued its multi-month downtrend, now reaching a new low of around 18.3M ETH held on trading platforms. This persistent decline suggests long-term holders and institutions are moving assets into cold storage or staking, reducing immediate sell pressure.
Despite the bearish price action, the supply on exchanges is not increasing, which historically has acted as a bullish divergence when accompanied by reversal structures. The low reserves may act as a supply constraint once demand re-emerges, but for now, the lack of bullish momentum means this on-chain trend is supportive, not decisive.
The post What’s Next for ETH After 10% Weekly Decline? Ethereum Price Analysis appeared first on CryptoPotato.
—
Blog powered by G6
Disclaimer! A guest author has made this post. G6 has not checked the post. its content and attachments and under no circumstances will G6 be held responsible or liable in any way for any claims, damages, losses, expenses, costs or liabilities whatsoever (including, without limitation, any direct or indirect damages for loss of profits, business interruption or loss of information) resulting or arising directly or indirectly from your use of or inability to use this website or any websites linked to it, or from your reliance on the information and material on this website, even if the G6 has been advised of the possibility of such damages in advance.
For any inquiries, please contact legal@gsix.org