The XRP price was caught in the latest crypto market-wide selloff, falling to an intraday low of $1.57 within the past 24 hours. The sudden drop brings into focus XRP’s higher-timeframe structure, which is teasing a break below the 33-month exponential moving average.
According to a technical assessment shared on X by crypto analyst Egrag Crypto, the recent drop below the 33-month exponential moving average does not automatically signal the end of XRP’s cycle, but XRP must close above an exact level to avoid a macro bearish confirmation.
At the time of writing, XRP is back to trading around $1.65, stabilizing after a volatile few hours that forced many traders to reassess the broader structure. However, according to technical analysis by Egrag Crypto, the most recent crash saw XRP breaking a bit below the 33 EMA on the monthly candlestick timeframe chart.
Egrag based the recent price action around one critical condition: a confirmed monthly close below $1.60 and the 33 EMA. According to the analyst, such a close would mark a macro bearish confirmation based on historical structure, not sentiment or opinion.
The chart he shared highlights how XRP has respected the 33 EMA as a long-term trend reference across multiple cycles, with violations often preceding extended corrective phases. As shown in the chart below, the XRP price has been trading above the 33-EMA since early 2025, even during periods of corrections. However, XRP is now trading dangerously close to this EMA, and there is now a risk of a breakdown.
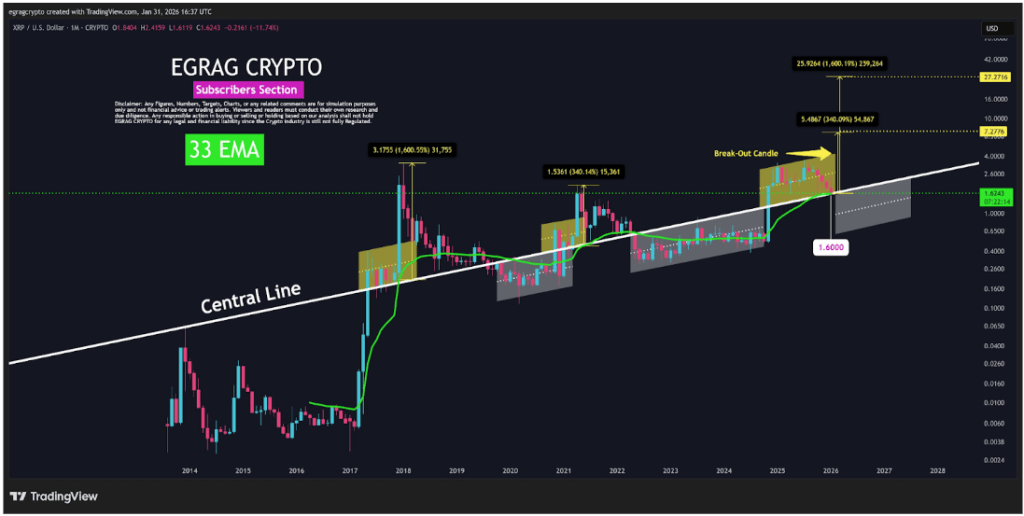
XRP Price Chart. Source: @egragcrypto On X
There’s a risk that XRP can transition into a macro bear structure. At the same time, there’s enough reason to suggest an upside bounce for the cryptocurrency. A major point in Egrag’s analysis is historical performance that shows XRP’s strongest upside expansions did not require a clean bull-market environment.
Therefore, there are two historical analogs of how XRP can play out from its current range around $1.60. The first is a repeat of the 2021-style move. This move, measured from similar structural conditions, would imply an upside expansion of roughly 340% with a price target around the $7 region.
The second one is a repeat of the 2017 cycle. Comparison to the 2017 cycle projects a much larger structural expansion of about 1,600%, which would align with the $27 zone highlighted on the chart above. In both cases, the rallies originated from oversold conditions and compression ranges, not from a strong bullish macro confirmation like many would expect.
According to the analysis, a breakdown below $1.60 could still lead to panic selling and reinforce fear narratives of a macro bear market, yet those same conditions have previously been the zones where late sellers exit just before volatility expands upward.
Featured image from Unsplash, chart from TradingView
—
Blog powered by G6
Disclaimer! A guest author has made this post. G6 has not checked the post. its content and attachments and under no circumstances will G6 be held responsible or liable in any way for any claims, damages, losses, expenses, costs or liabilities whatsoever (including, without limitation, any direct or indirect damages for loss of profits, business interruption or loss of information) resulting or arising directly or indirectly from your use of or inability to use this website or any websites linked to it, or from your reliance on the information and material on this website, even if the G6 has been advised of the possibility of such damages in advance.
For any inquiries, please contact [email protected]


