XRP price is holding gains above the $0.5920 zone. The price could gain bullish momentum if it clears the $0.6120 resistance level.
XRP price is consolidating gains below the $0.6120 resistance zone.
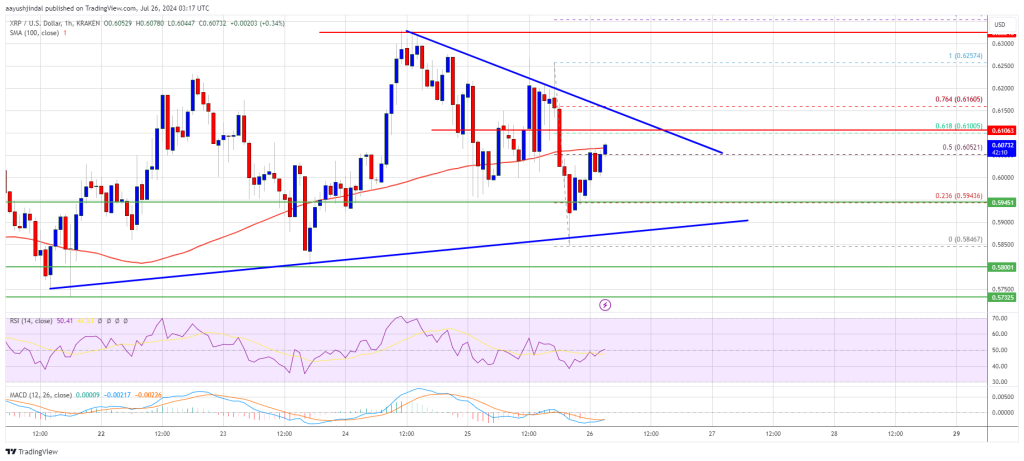
The price is now trading near $0.6050 and the 100-hourly Simple Moving Average.
There is a key contracting triangle forming with resistance at $0.6120 on the hourly chart of the XRP/USD pair (data source from Kraken).
The pair could start another increase if it stays above the $0.5920 support zone.
XRP price remained stable above the $0.580 support zone. It traded as low as $0.5846 and recently started an upward move. There was a clear move above the $0.600 resistance zone, but it lagged momentum like Bitcoin and Ethereum.
There was a move above the 50% Fib retracement level of the downward move from the $0.6257 swing high to the $0.5846 low. It is now trading near $0.6050 and the 100-hourly Simple Moving Average.
If there are more upsides, the price could face resistance near the $0.6120 level. There is also a key contracting triangle forming with resistance at $0.6120 on the hourly chart of the XRP/USD pair. The stated triangle resistance is close to the 61.8% Fib retracement level of the downward move from the $0.6257 swing high to the $0.5846 low.
The first major resistance is near the $0.6250 level. The next key resistance could be $0.6320. A clear move above the $0.6320 resistance might send the price toward the $0.6450 resistance. The next major resistance is near the $0.6550 level. Any more gains might send the price toward the $0.680 resistance.
If XRP fails to clear the $0.6120 resistance zone, it could start another decline. Initial support on the downside is near the $0.6020 level. The next major support is at $0.5920 and the triangle’s trend line zone.
If there is a downside break and a close below the $0.5920 level, the price might continue to decline toward the $0.580 support in the near term. The next major support sits at $0.5650.
Technical Indicators
Hourly MACD – The MACD for XRP/USD is now gaining pace in the bullish zone.
Hourly RSI (Relative Strength Index) – The RSI for XRP/USD is now near the 50 level.
Major Support Levels – $0.5920 and $0.5800.
Major Resistance Levels – $0.6120 and $0.6250.
—
Blog powered by G6
Disclaimer! A guest author has made this post. G6 has not checked the post. its content and attachments and under no circumstances will G6 be held responsible or liable in any way for any claims, damages, losses, expenses, costs or liabilities whatsoever (including, without limitation, any direct or indirect damages for loss of profits, business interruption or loss of information) resulting or arising directly or indirectly from your use of or inability to use this website or any websites linked to it, or from your reliance on the information and material on this website, even if the G6 has been advised of the possibility of such damages in advance.
For any inquiries, please contact [email protected]


