XRP price started a downside correction from the $0.750 zone. The price retested the $0.600 support zone and might soon attempt a fresh rally.
XRP started a downside correction from the $0.750 resistance zone.
The price is now trading below $0.650 and the 100 simple moving average (4 hours).
There is a major bearish trend line forming with resistance near $0.6550 on the 4-hour chart of the XRP/USD pair (data source from Kraken).
The pair might correct further lower, but the bulls could remain active near $0.600.
After rallying above the $0.720 resistance, XRP faced resistance. The price struggled to clear the $0.750 barrier and recently started a downside correction, like Bitcoin and Ethereum.
The price declined below the $0.720 and $0.700 support levels. The bears even pushed it below the $0.650 pivot level. However, the bulls were active near the $0.600 zone. A low is formed near $0.5938 and the price is now attempting a fresh increase.
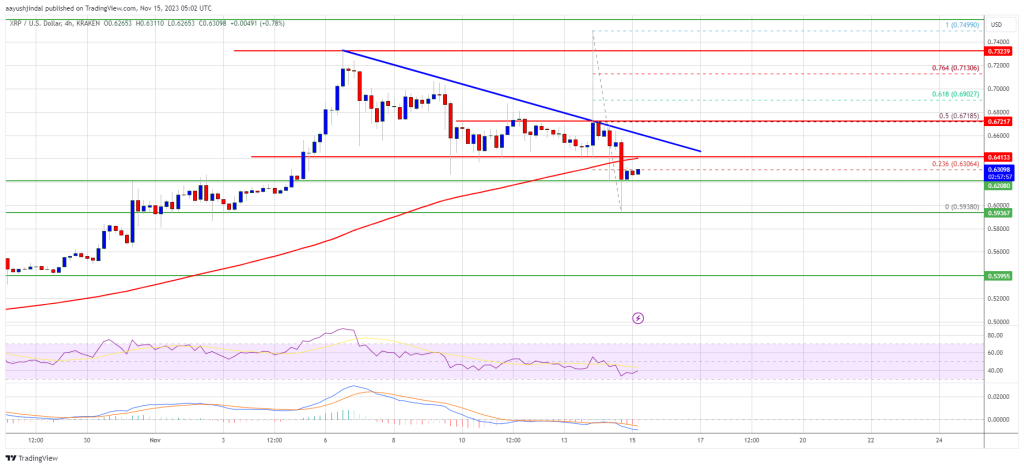
XRP is now trading below $0.650 and the 100 simple moving average (4 hours). There is also a major bearish trend line forming with resistance near $0.6550 on the 4-hour chart of the XRP/USD pair.
On the upside, immediate resistance is near the $0.630 level or the 23.6% Fib retracement level of the recent decline from the $0.7499 swing high to the $0.5938 low. The first major resistance is near the $0.640 zone or the trend line.
Source: XRPUSD on TradingView.com
A close above the trend line could send the price toward the $0.672 resistance. It is near the 50% Fib retracement level of the recent decline from the $0.7499 swing high to the $0.5938 low. If the bulls remain in action above the $0.672 resistance level, there could be a rally toward the $0.750 resistance. Any more gains might send XRP toward the $0.788 resistance.
If XRP fails to clear the $0.640 resistance zone, it could continue to move down. Initial support on the downside is near the $0.620 zone.
The next major support is at $0.600. If there is a downside break and a close below the $0.600 level, XRP price might accelerate lower. In the stated case, the price could retest the $0.540 support zone.
Technical Indicators
4-Hours MACD – The MACD for XRP/USD is now losing pace in the bullish zone.
4-Hours RSI (Relative Strength Index) – The RSI for XRP/USD is now below the 50 level.
Major Support Levels – $0.620, $0.600, and $0.540.
Major Resistance Levels – $0.630, $0.640, and $0.672.
—
Blog powered by G6
Disclaimer! A guest author has made this post. G6 has not checked the post. its content and attachments and under no circumstances will G6 be held responsible or liable in any way for any claims, damages, losses, expenses, costs or liabilities whatsoever (including, without limitation, any direct or indirect damages for loss of profits, business interruption or loss of information) resulting or arising directly or indirectly from your use of or inability to use this website or any websites linked to it, or from your reliance on the information and material on this website, even if the G6 has been advised of the possibility of such damages in advance.
For any inquiries, please contact [email protected]


