XRP price is struggling to recover above the $0.520 resistance. The price could gain bearish momentum if it breaks the $0.50 support.
XRP is attempting a fresh increase and facing hurdles near $0.520.
The price is now trading near $0.5150 and the 100 simple moving average (4 hours).
There is a major bearish trend line forming with resistance at $0.520 on the 4-hour chart of the XRP/USD pair (data source from Kraken).
The pair could gain bullish momentum if there is a close above the $0.520 resistance.
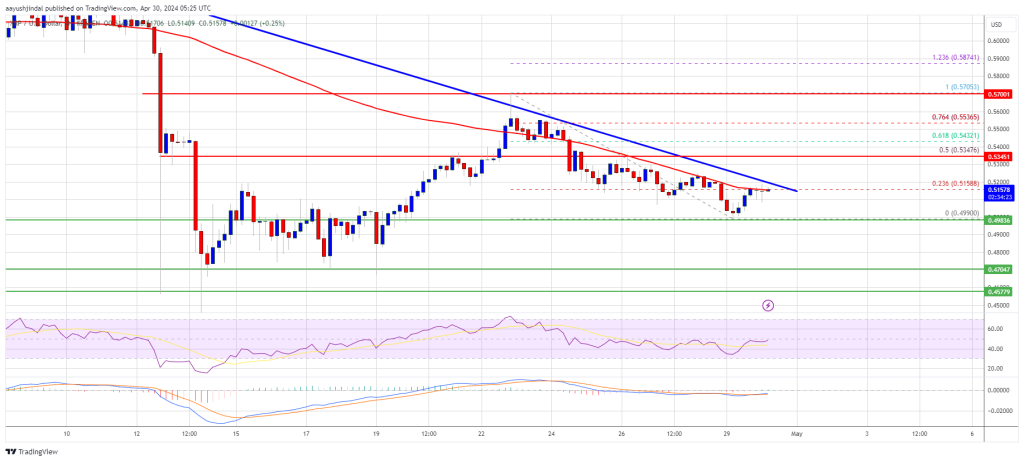
Recently, XRP price climbed above the $0.550 resistance and tested $0.570. A high was formed at $0.5705 before there was a pullback like Bitcoin and Ethereum. The price dipped below the $0.5250 support zone.
It even spiked below $0.500 and tested $0.4980. A low was formed at $0.4990 and the price is now consolidating near the 23.6% Fib retracement level of the downward move from the $0.5705 swing high to the $0.4990 low. It also trades near $0.5150 and the 100 simple moving average (4 hours).
Immediate resistance is near the $0.520 level. There is also a major bearish trend line forming with resistance at $0.520 on the 4-hour chart of the XRP/USD pair.
Source: XRPUSD on TradingView.com
The next key resistance is near $0.5350 or the 50% Fib retracement level of the downward move from the $0.5705 swing high to the $0.4990 low. A close above the $0.5350 resistance zone could spark a strong increase. The next key resistance is near $0.570. If the bulls remain in action above the $0.570 resistance level, there could be a rally toward the $0.620 resistance. Any more gains might send the price toward the $0.680 resistance.
If XRP fails to clear the $0.520 resistance zone, it could start another decline. Initial support on the downside is near the $0.500 level.
The next major support is at $0.490. If there is a downside break and a close below the $0.490 level, the price might accelerate lower. In the stated case, the price could retest the $0.460 support zone.
Technical Indicators
4-Hours MACD – The MACD for XRP/USD is now gaining pace in the bullish zone.
4-Hours RSI (Relative Strength Index) – The RSI for XRP/USD is now near the 50 level.
Major Support Levels – $0.500, $0.4990, and $0.460.
Major Resistance Levels – $0.520, $0.5350, and $0.570.
—
Blog powered by G6
Disclaimer! A guest author has made this post. G6 has not checked the post. its content and attachments and under no circumstances will G6 be held responsible or liable in any way for any claims, damages, losses, expenses, costs or liabilities whatsoever (including, without limitation, any direct or indirect damages for loss of profits, business interruption or loss of information) resulting or arising directly or indirectly from your use of or inability to use this website or any websites linked to it, or from your reliance on the information and material on this website, even if the G6 has been advised of the possibility of such damages in advance.
For any inquiries, please contact [email protected]


